Deltek Acumen Fuse schedule metrics help schedulers plot the trend of a project. This enables them to quickly spot schedule issues or opportunities, and respond accordingly. This is useful for when project managers plot scheduling metrics over time, trends appear that provide valuable insight into the true schedule situation.
As a general scheduling rule, if something is trending up it tends to keep trending up. And something trending down keeps trending down, unless an external stimulus is applied.
So, when you have an undesirable schedule metric that is going up you have to do something or it will continue going up. On the other hand if you have a favorable metric that is increasing you may want to capture that insight to take advantage of an opportunity.
This article demonstrates how to track the trend of using Deltek’s Acumen Fuse schedule metrics and schedule analysis.
Below in Figure 1 is our demonstration project.
 Figure 1
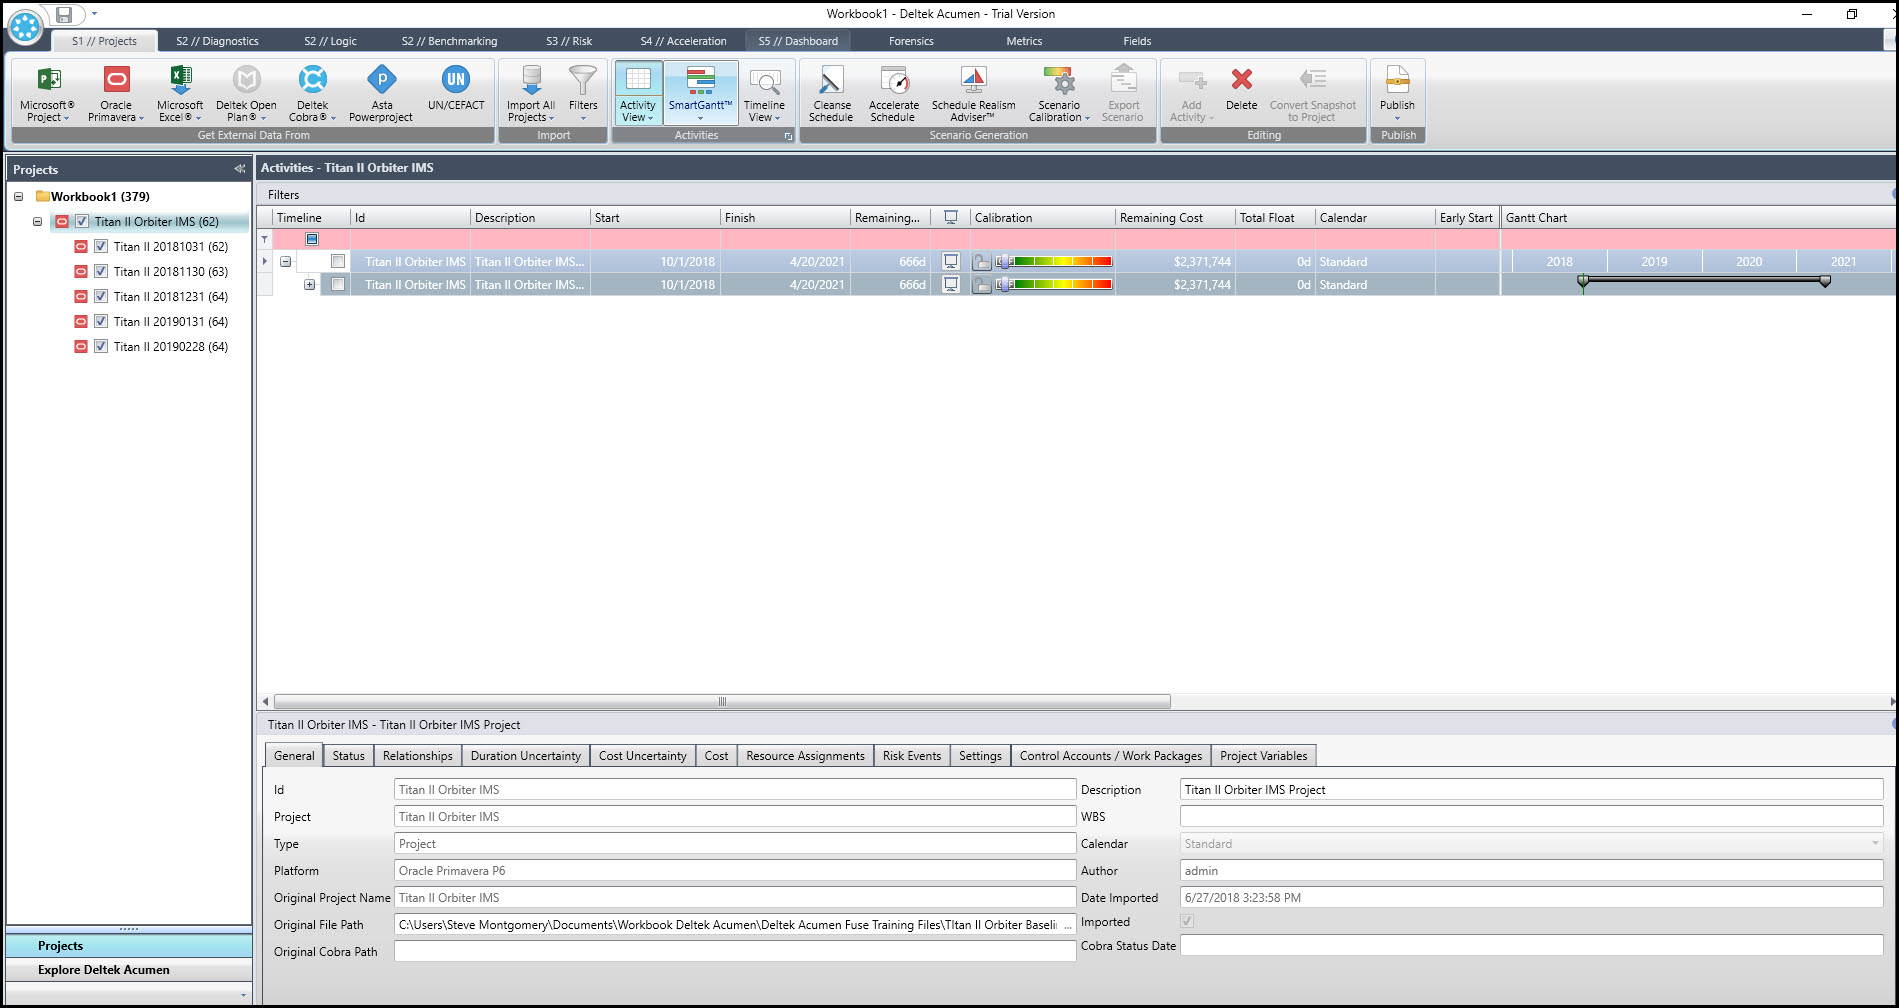
This Primavera P6 Professional project has a baseline and five updates, which were imported into Deltek Acumen. We proceed and select the diagnostics tab, Figure 2.
Figure 2
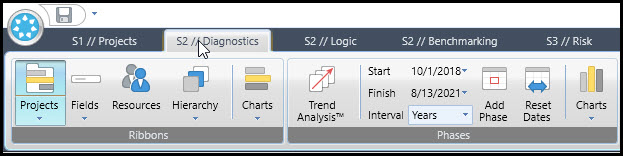
In the bottom analysis ribbon we choose Schedule Quality, if not already selected. In the analyze section of the diagnostics ribbon, Figure 3, we click the upper half of the Fuse button.
Figure 3
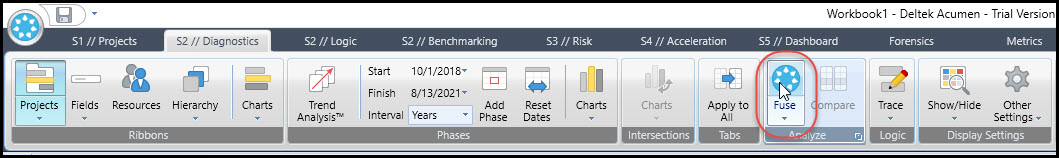
When the analysis completes ribbon and phase analyzer metrics appear similar to those displayed in Figure 4.
Figure 4
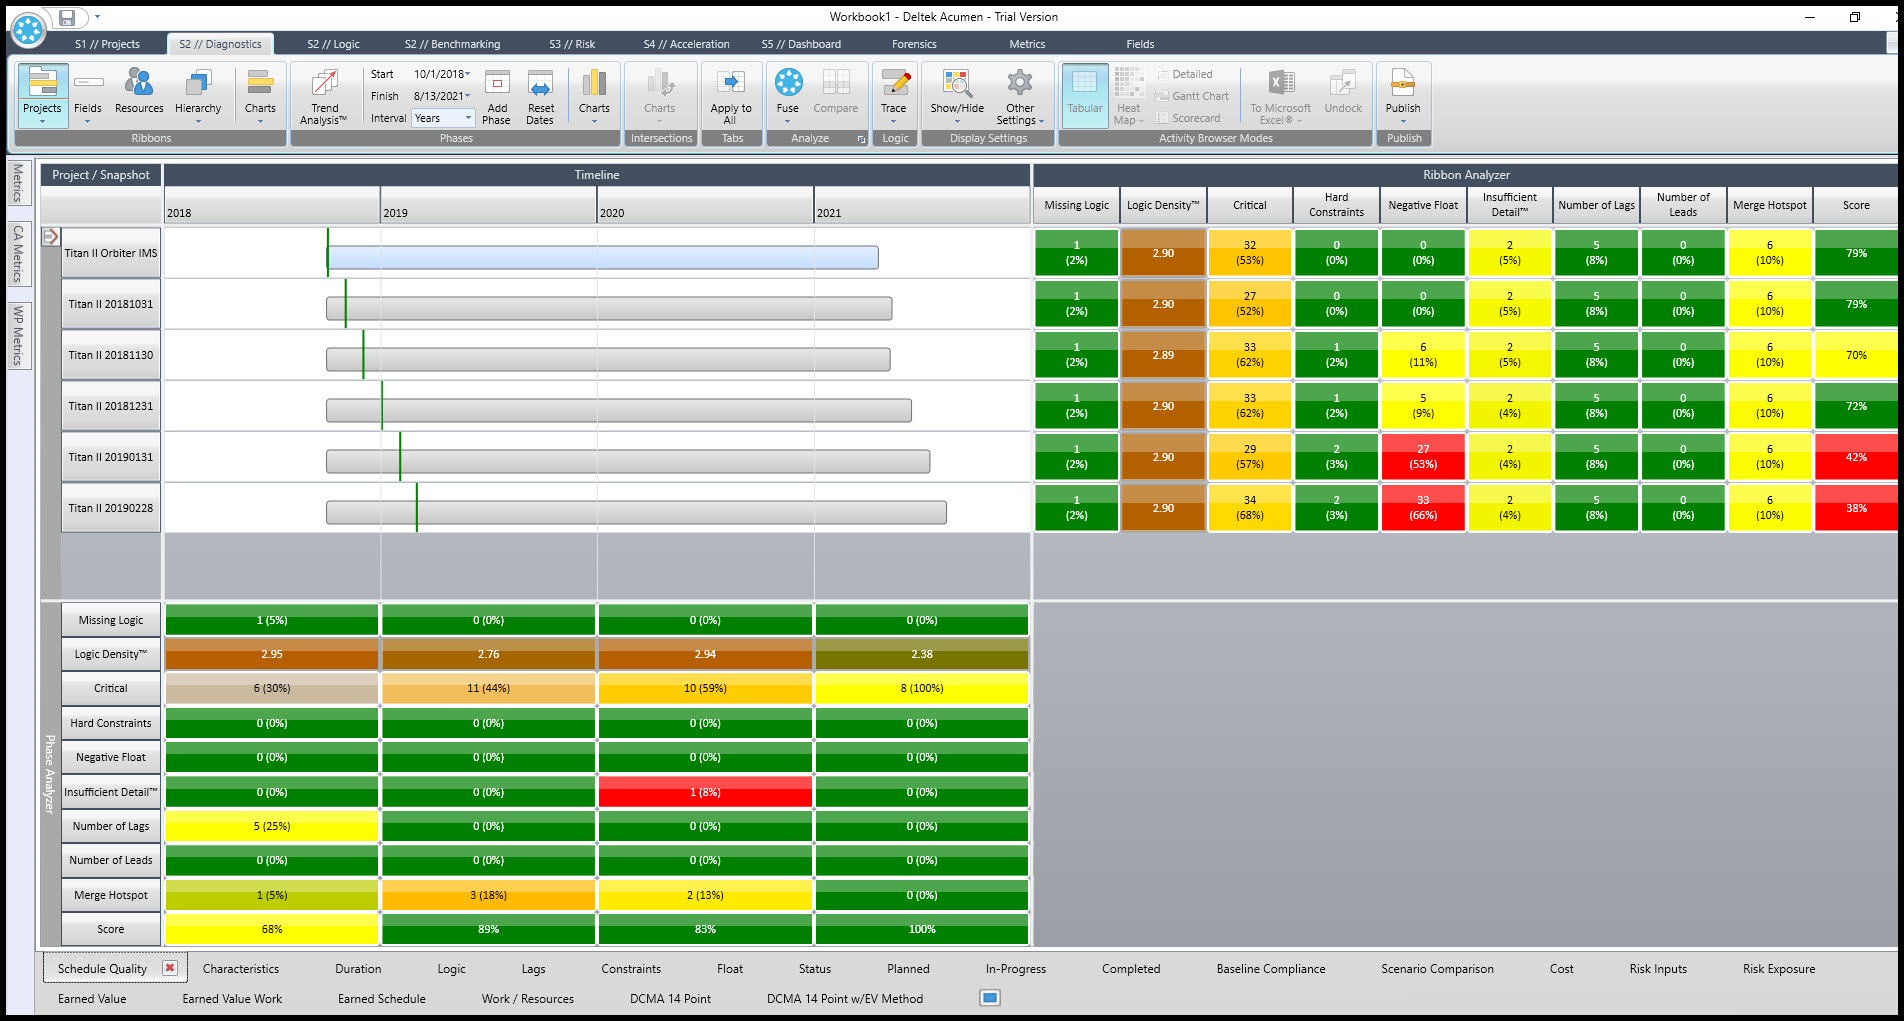
Our Schedule Quality analysis of the schedule is complete.
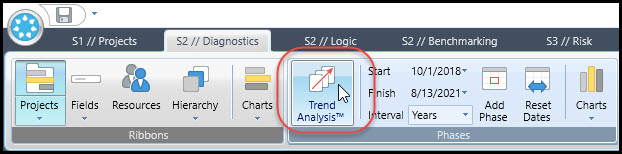
We, however, want to inspect some of these metrics over time to capture insight from a respective metric’s trending data. Proceed and click on trend analysis in the phases section of the diagnostics ribbon, Figure 5.
Figure 5
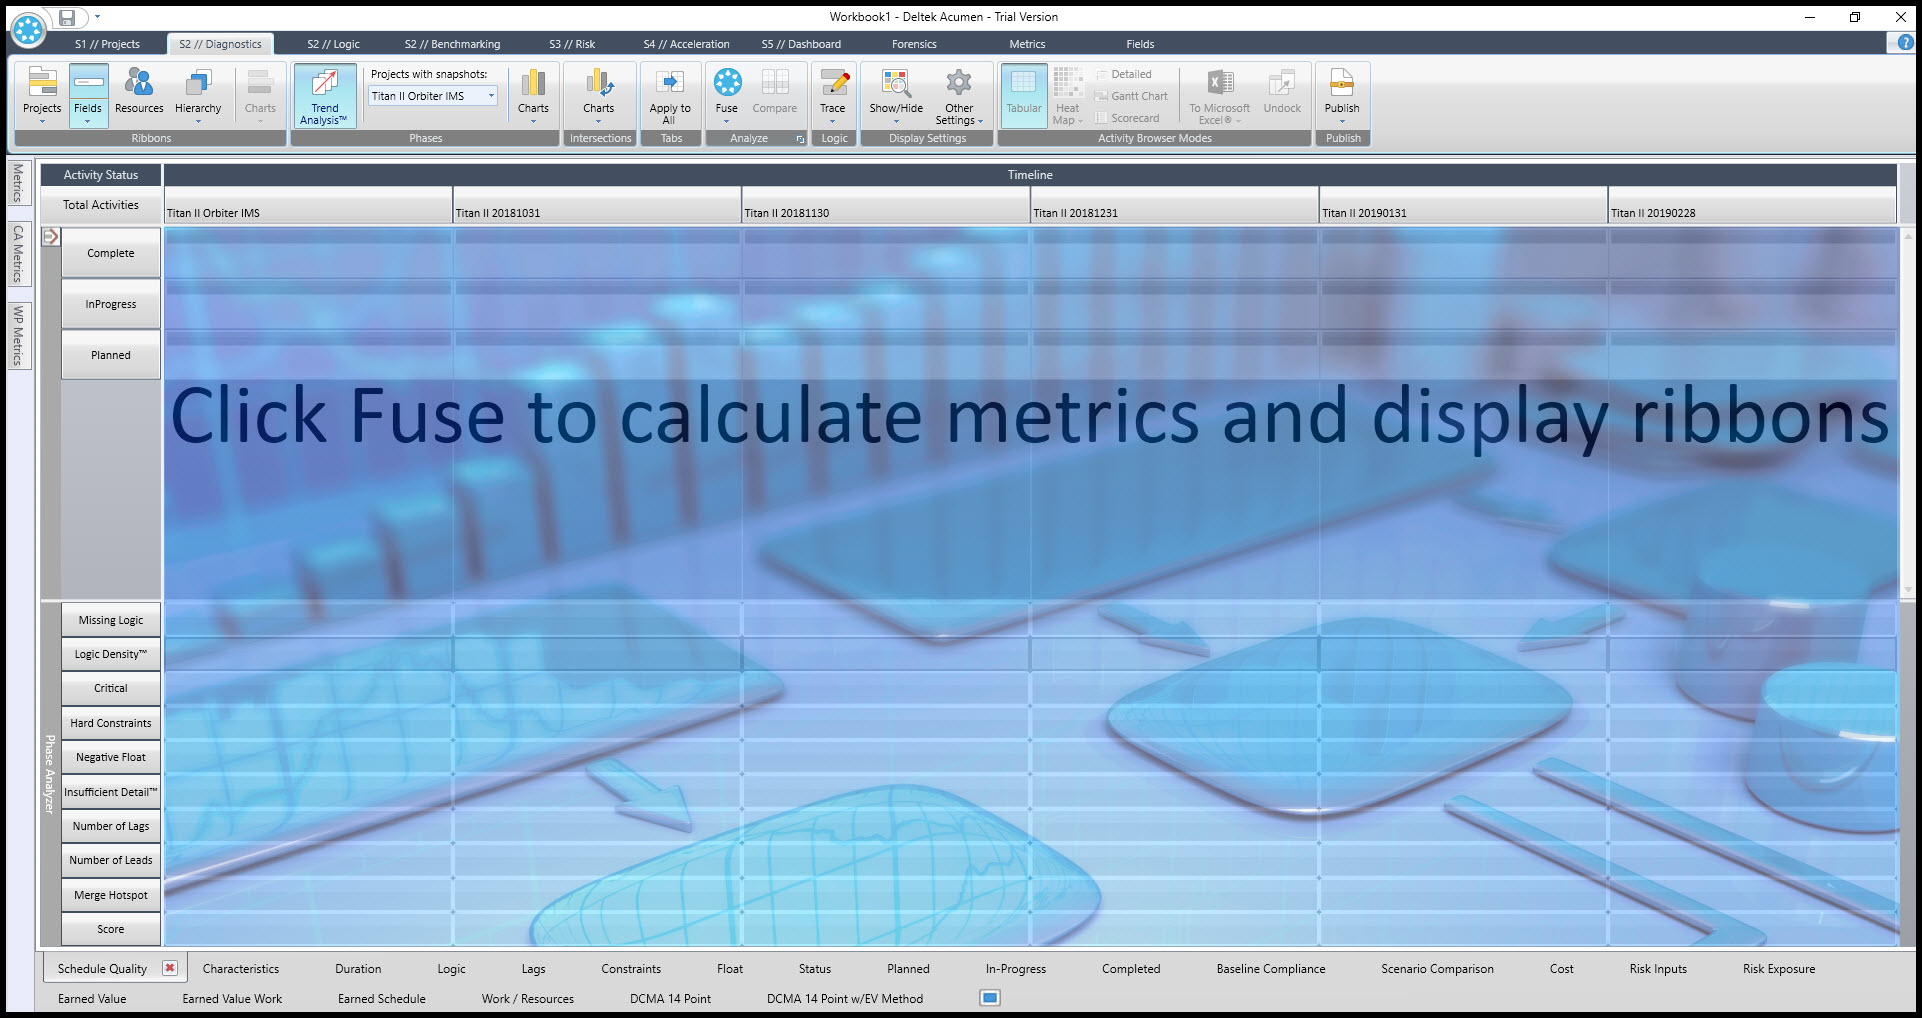
This changes the view of the project analysis window similar to Figure 6.
Figure 6
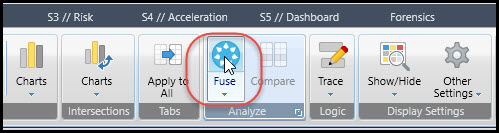
Once again click the upper half of the Fuse icon, Figure 7.
Figure 7
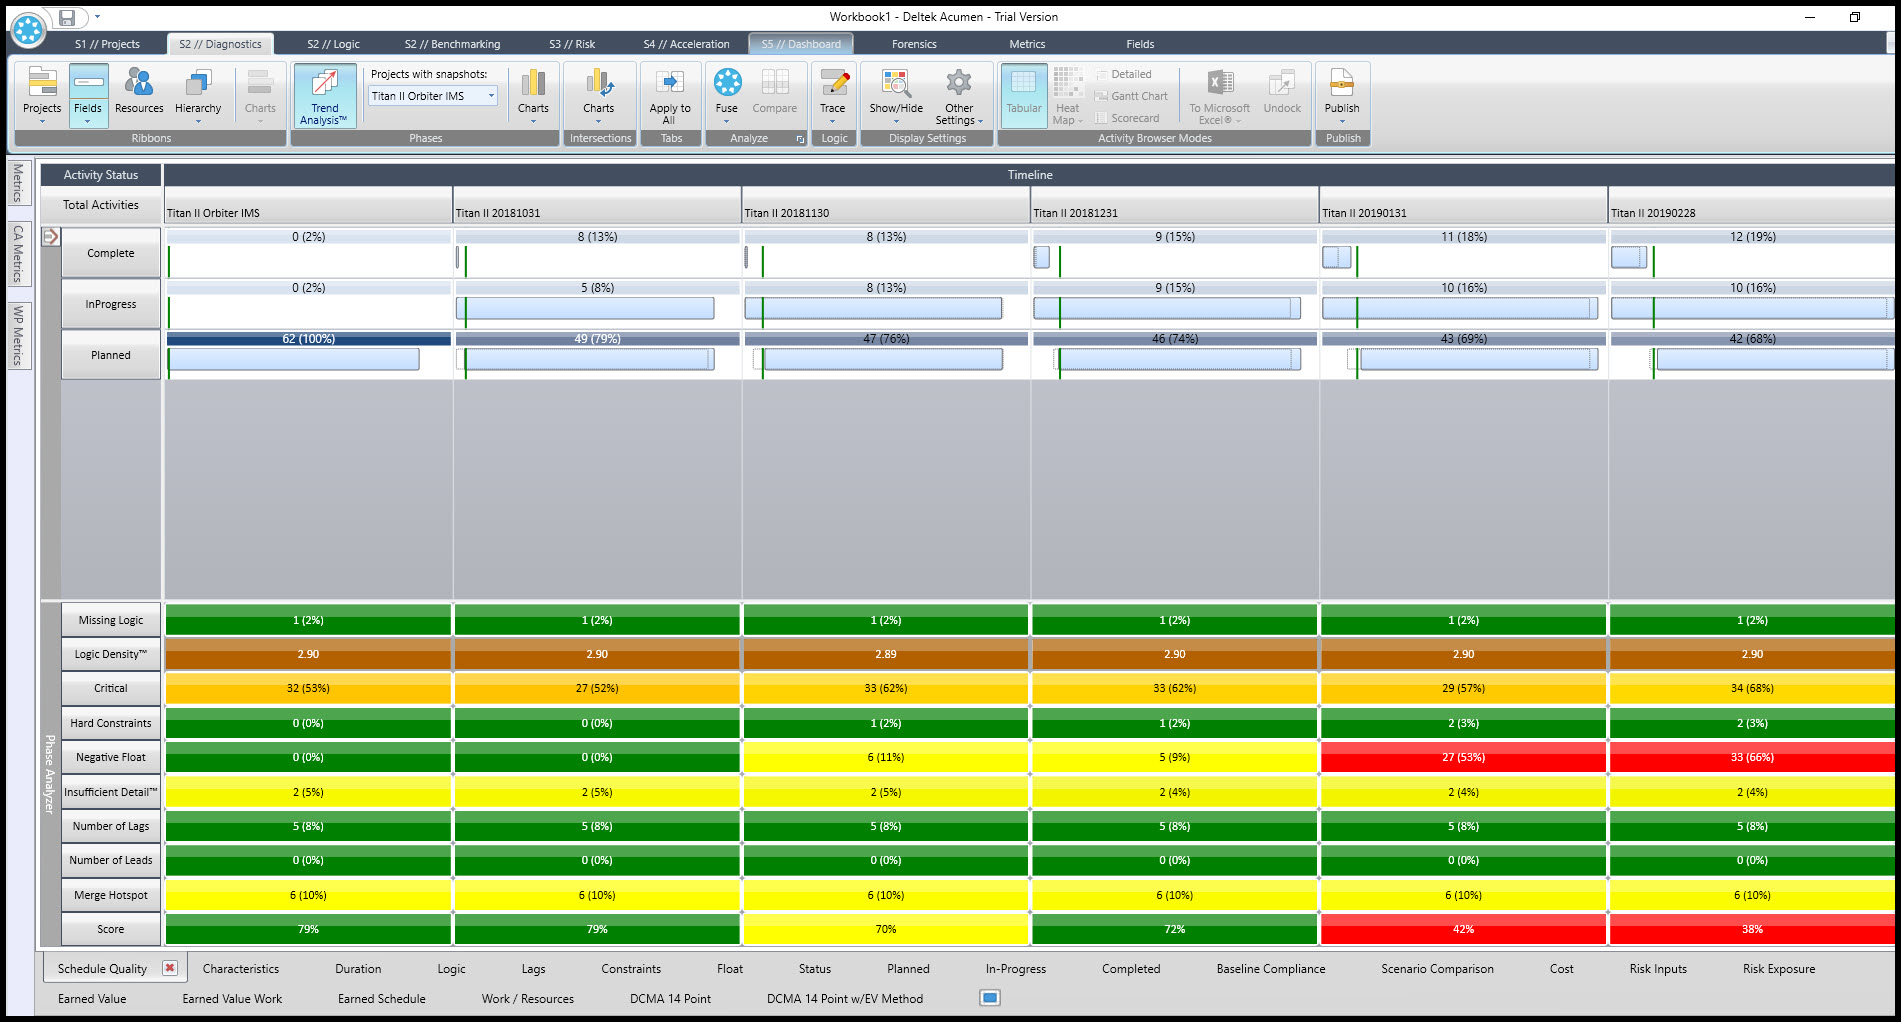
The analysis appears similar to Figure 8, which is a repeat of our previous schedule quality analysis, though the view is oriented differently and expanded.
Figure 8
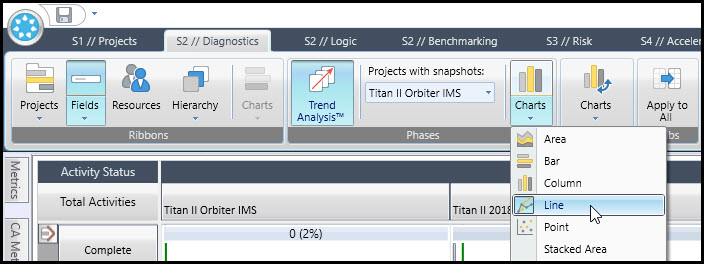
Now click on the bottom of the charts icon, Figure 9, and confirm it is set to display a line chart.
Figure 9
Continue and click the charts icon, Figure 10, to capture a trend.
Figure 10
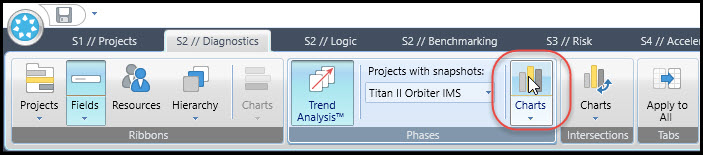
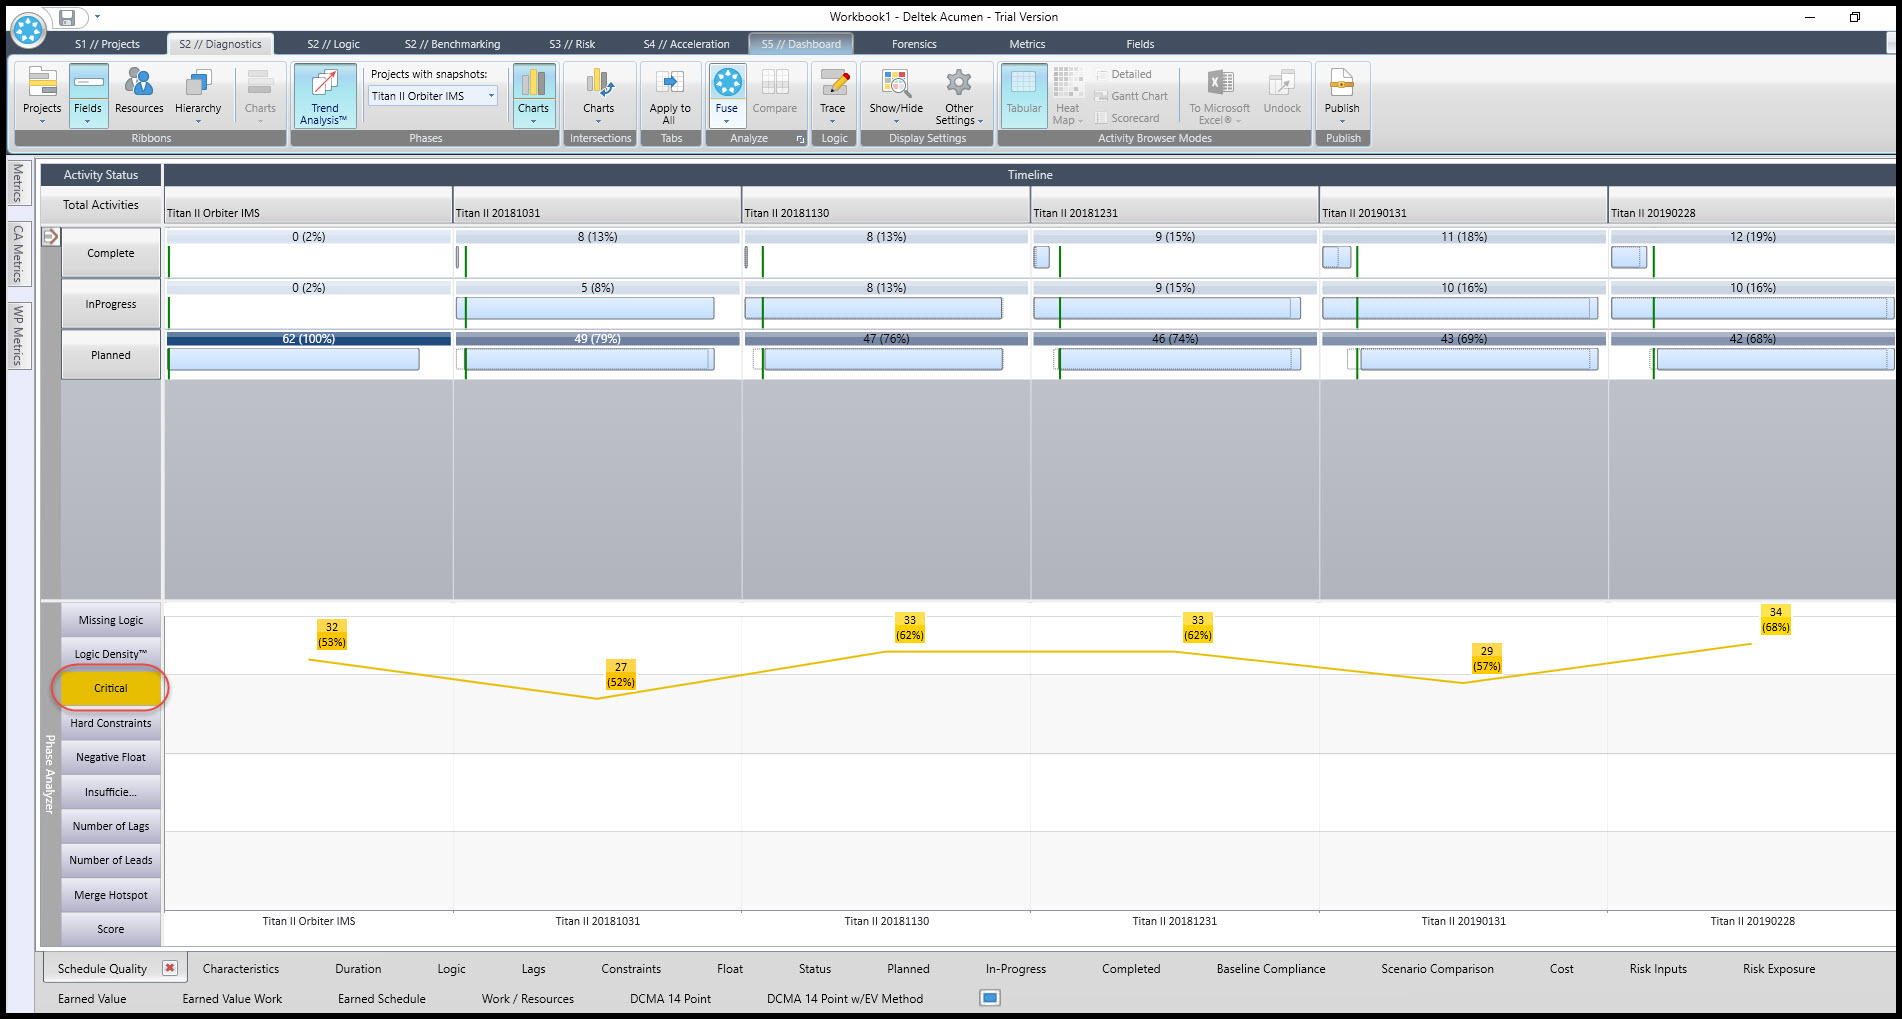
Figure 11 displays the trend for critical.
Figure 11
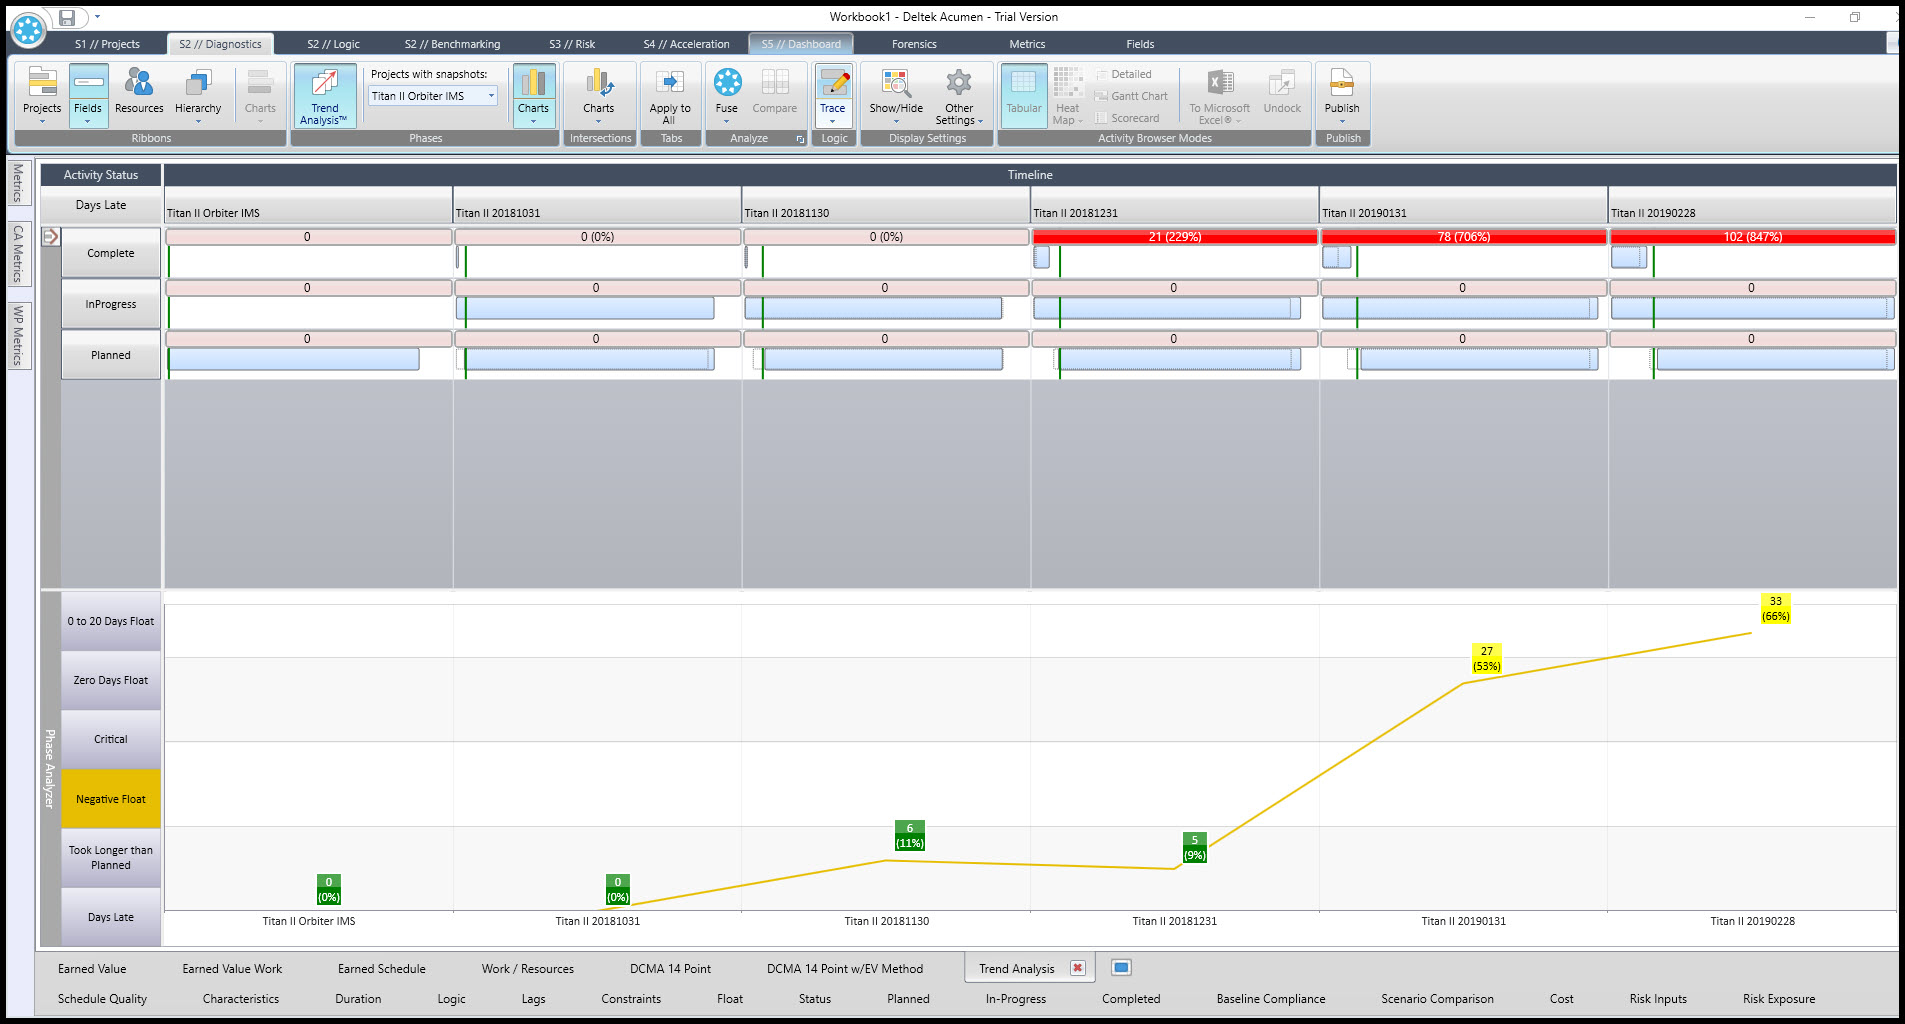
If no trend appears select anyone of the phase analyzer metrics on the left. In Figure 12 we choose negative float to add the negative float trend to the graph.
Figure 12
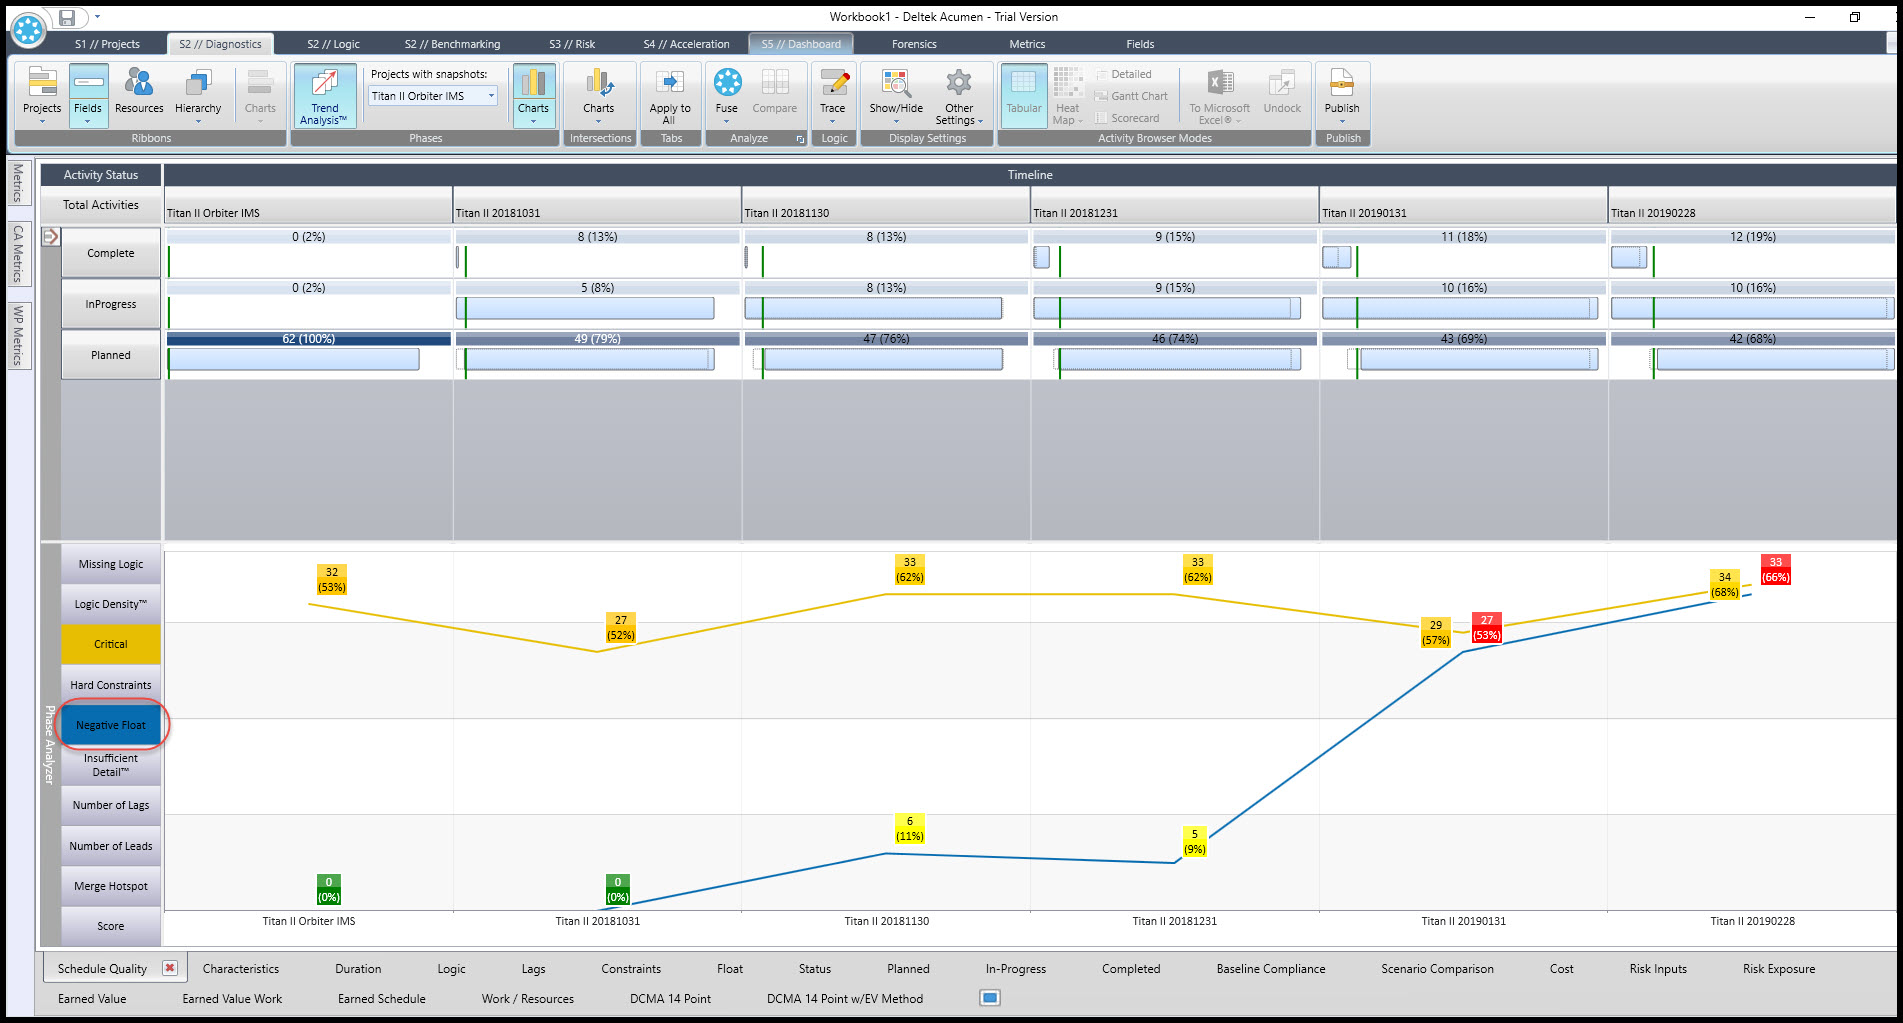
You may observe that the negative float for this schedule is increasing each reporting period, which is not a good trend. This trend began in reporting period two, so from reporting period two onward we are warned of a troublesome negative float trend. Our trend analysis thus provides insight early on that we have a negative float trend requiring corrective action. And this trend continues through all reporting periods.
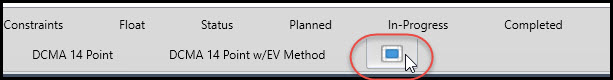
Deltek Acumen has an abundance of metrics that can be plotted for trend analysis. Let’s create a custom ribbon view to support analyzing some of these metric trends in our schedule. In the diagnostics tab bottom ribbon select insert new ribbon view button, Figure 13.
Figure 13
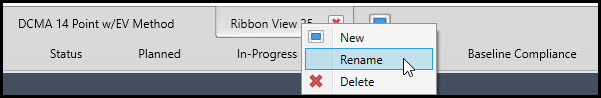
Right click on the new ribbon view and select rename from the list, Figure 14.
Figure 14
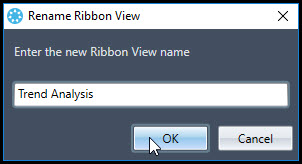
In the resulting rename ribbon view dialog enter the name trend analysis and click OK, Figure 15.
Figure 15
Proceeding, Figure 16, we click on the vertical metrics tab on the far left view to open the metrics list.
Figure 16
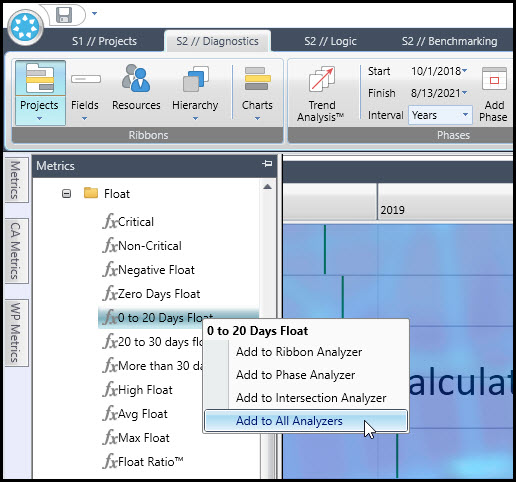
Now when we right-click on an individual metric, we are presented with a set of options to add it to the ribbon, phase, and all analyzers, Figure 17.
Figure 17
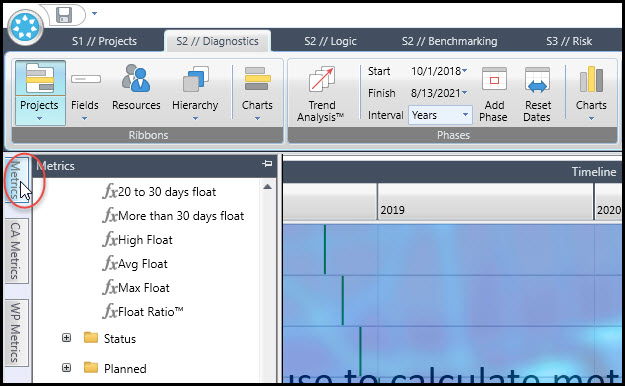
In the Float group, choose ‘ƒx0 to 20 Days Float’, which captures the trending of near critical tasks, and select add to all analyzers, again, Figure 17. Through this procedure we can build a custom analysis including metrics suited to our unique scheduling analysis requirements. Proceeding we add the following metrics from the Float group:
- ƒx Zero Days Float
- ƒx Critical
- ƒx Negative Float
We continue and insert the below from the Completed group:
- ƒxTook Longer than Planned
- ƒxDays Late
Now our customized analysis includes the metrics displayed in Figure 18.
Figure 18
Looking at the Negative Float and Days Late metrics, Figure 19, we observe these two metrics have unfavorable trends that start in the third reporting period.
Figure 19
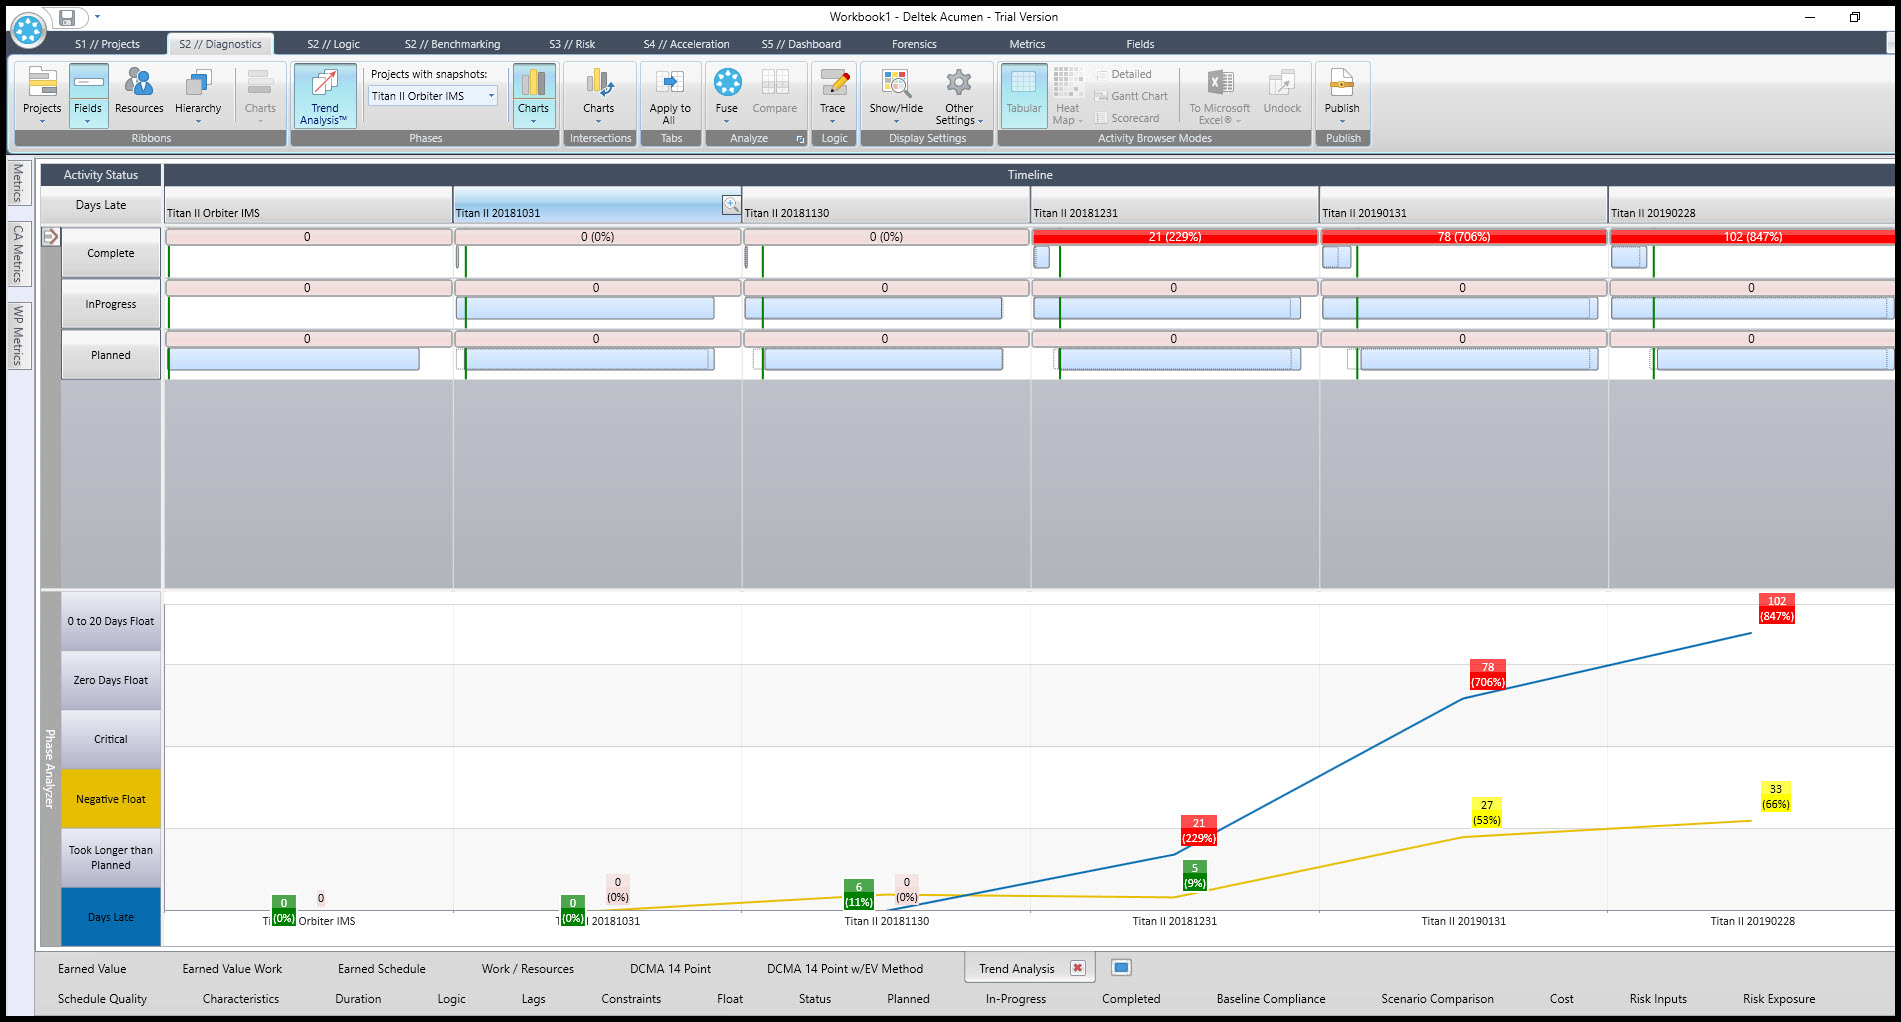
And as expected these negative trends continue on in an ever increasing negative direction.
Summary
Metric trends warn project managers early on of scheduling issues before they become major problems. Deltek Acumen Fuse has a myriad of metrics for individual trend analysis. They can also be grouped together in ribbon groups.
In this way, Deltek Acumen Fuse schedule metrics provides the project manager a wealth of metrics that are customizable in metric groups to provide personalized and helpful insight into the project’s current schedule situation.