Quick Tip – Using Deltek Acumen Histogram Plots
So, you want to know how many days contingency on your deterministic schedule are required to achieve a completion date on your risk adjusted schedule, at an 80% confidence level? It is possible to determine the required contingency to achieve an 80% confidence level in Deltek Acumen’s histogram plot. Let’s take a look at this.
Deltek Acumen histogram plots provide the completion dates and associated confidence levels of risk adjusted schedules. In this way schedulers can specify the completion date of the project and the confidence level of achieving that date.
The question is how many days contingency from the deterministic completion date will achieving this level of confidence require? Well, Deltek Acumen histogram plots provide an efficient way to find out required contingency for respective confidence levels.
This article provides a quick tip to demonstrate how to determine required contingency for a specified confidence level directly on Deltek Acumen’s histogram plots.
We have below in Figure 1, a Deltek Acumen histogram plot of a risk adjusted schedule.
 Figure 1
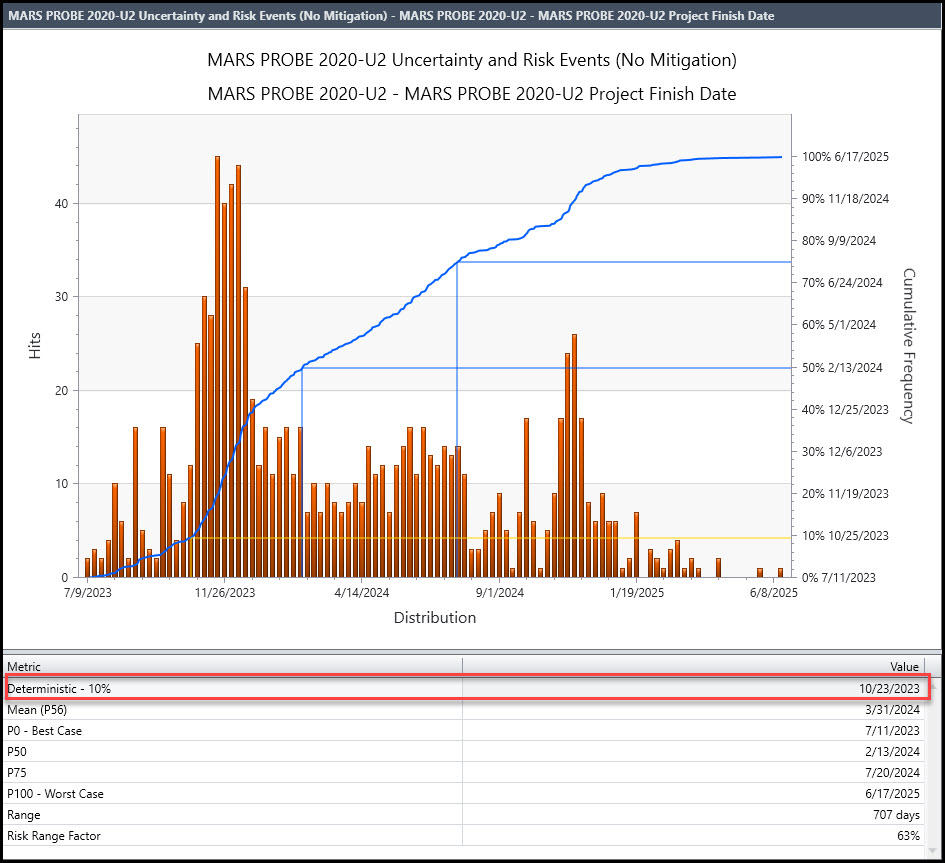
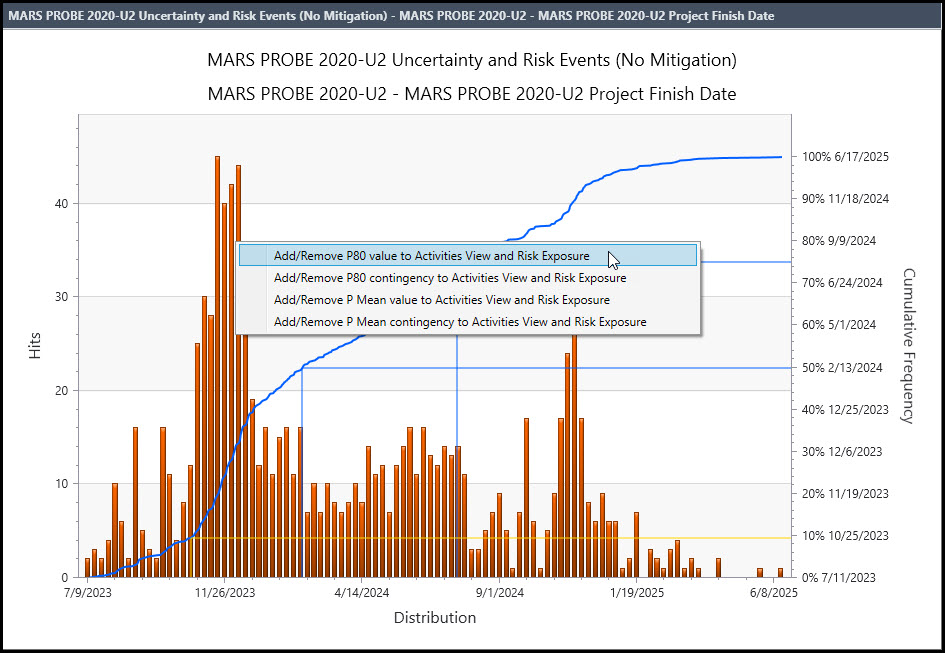
Note that the deterministic schedule end date was only achieved in 10% of the Monte Carlo iterations. We want to know how much contingency to add to the deterministic end date to have a completion date that provides an 80% confidence level of achievement. We begin first by finding the end date of the risk adjusted schedule at the 80% confidence level. In Figure 2 we locate the mouse at the horizontal 80% confidence level and left click the mouse.
Figure 2

Up pops a menu, Figure 3, with the option of inserting a P80 value on the histogram graph.
Figure 3
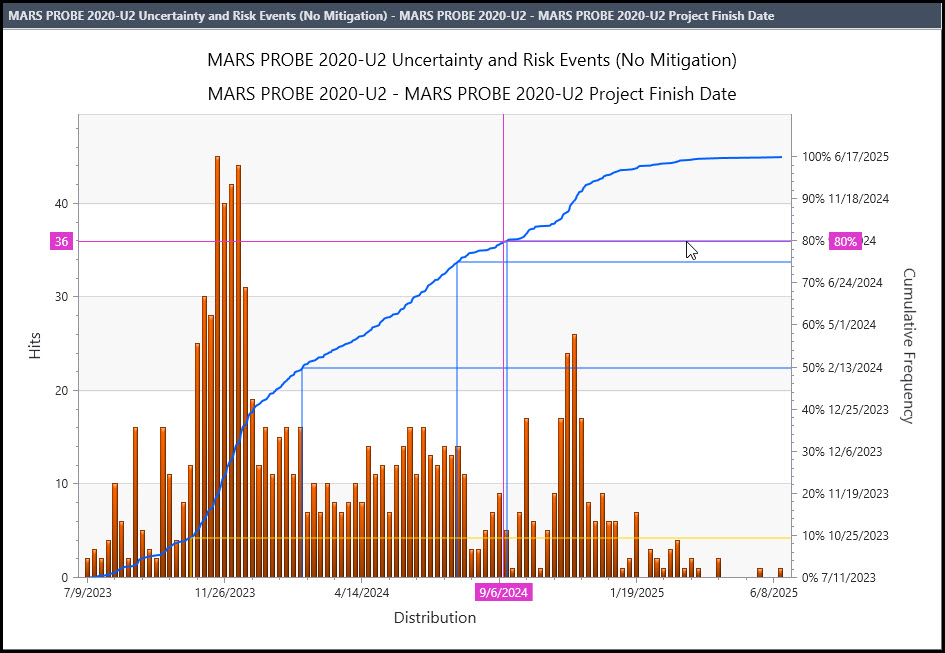
We choose to display the P80 value on the risk exposure graph. Figure 4 displays the histogram graph and 80% confidence level specification.
Figure 4

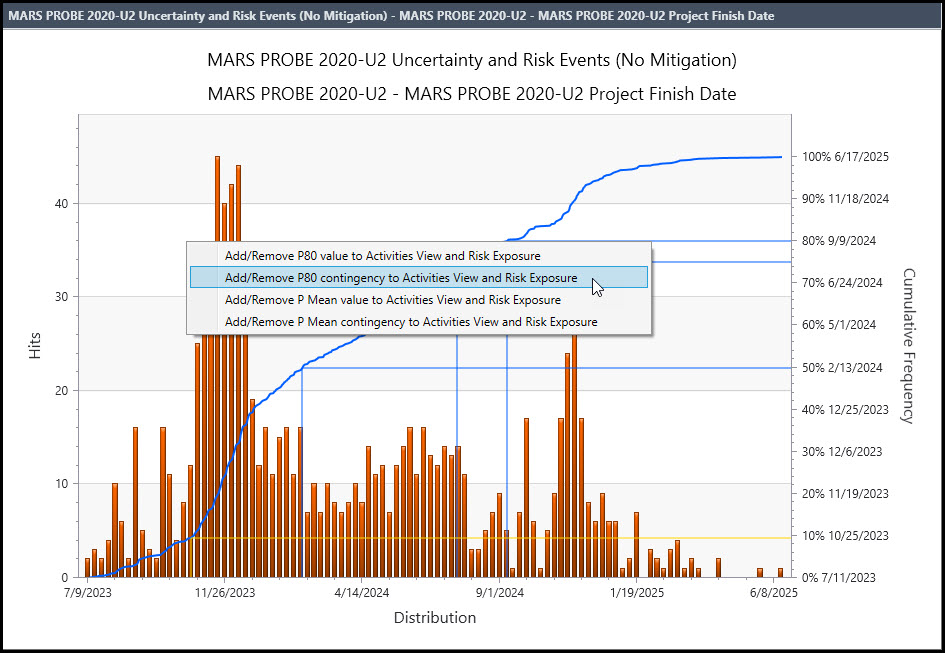
To find the contingency we again locate the mouse at the 80% confidence level and left click, Figure 5.
Figure 5
From the resulting popup menu this time we choose P80 contingency, Figure 6.
Figure 6
The contingency appears as a red box between P80 position and the Deterministic 10% position on the chart, Figure 7.
Figure 7
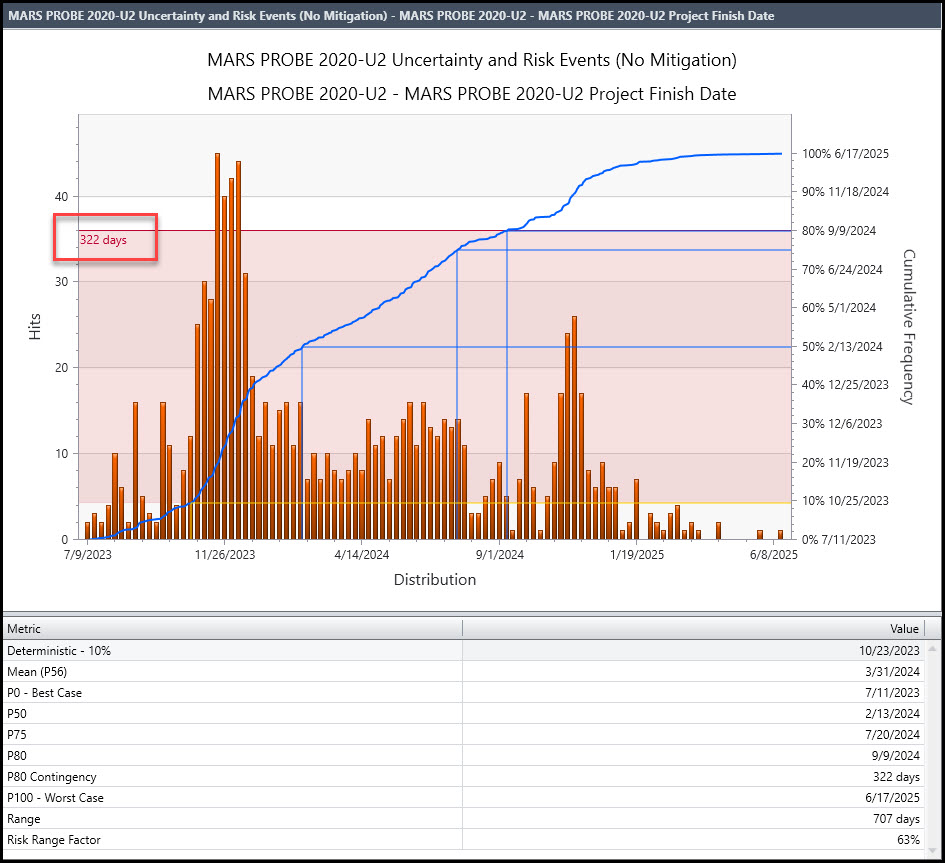
As indicated on the graph this period spans 322 days. The scheduler therefore know that in order to have a risk adjusted schedule completion date with an 80% confidence level they must add 322 days contingency to the deterministic schedule’s end date.
Summary
The deterministic schedule end date is not always realistic as it is very difficult to predict completion on an exact date. It is better to risk adjust the schedule and, from that, develop confidence levels and ranges into which we know we are going to fall.
Deltek Acumen histogram plots the results of the Monte Carlo analysis in a histogram graph. From this histogram plot, the scheduler can then find the number of days contingency from the deterministic schedule from which to achieve a respective confidence level.
In this way the scheduler can provide a risk adjusted schedule end date, their confidence in achieving this date, and the required number of days contingency beyond the deterministic schedule this completion date requires.