Microsoft Project has a Quick Access Toolbar which can help any scheduler with repeated commands. By placing frequently used commands on the Toolbar life can be made easier, instead of searching back and forth between ribbons. Microsoft Project recognizes that users may want quick access for repeated commands at the click of a button. This toolbar allows schedulers to modify the commands switching them whenever they need to, depending on their personal preference and whereabouts the project is in its’ life cycle.
The Project Statistics is a great example of a scheduling feature which users may want quick access to in Microsoft Project so that they can assess their project information quickly. So how do you modify the Quick Access Toolbar in Microsoft Project to incorporate the project statistics dialog? Let’s take a closer look:
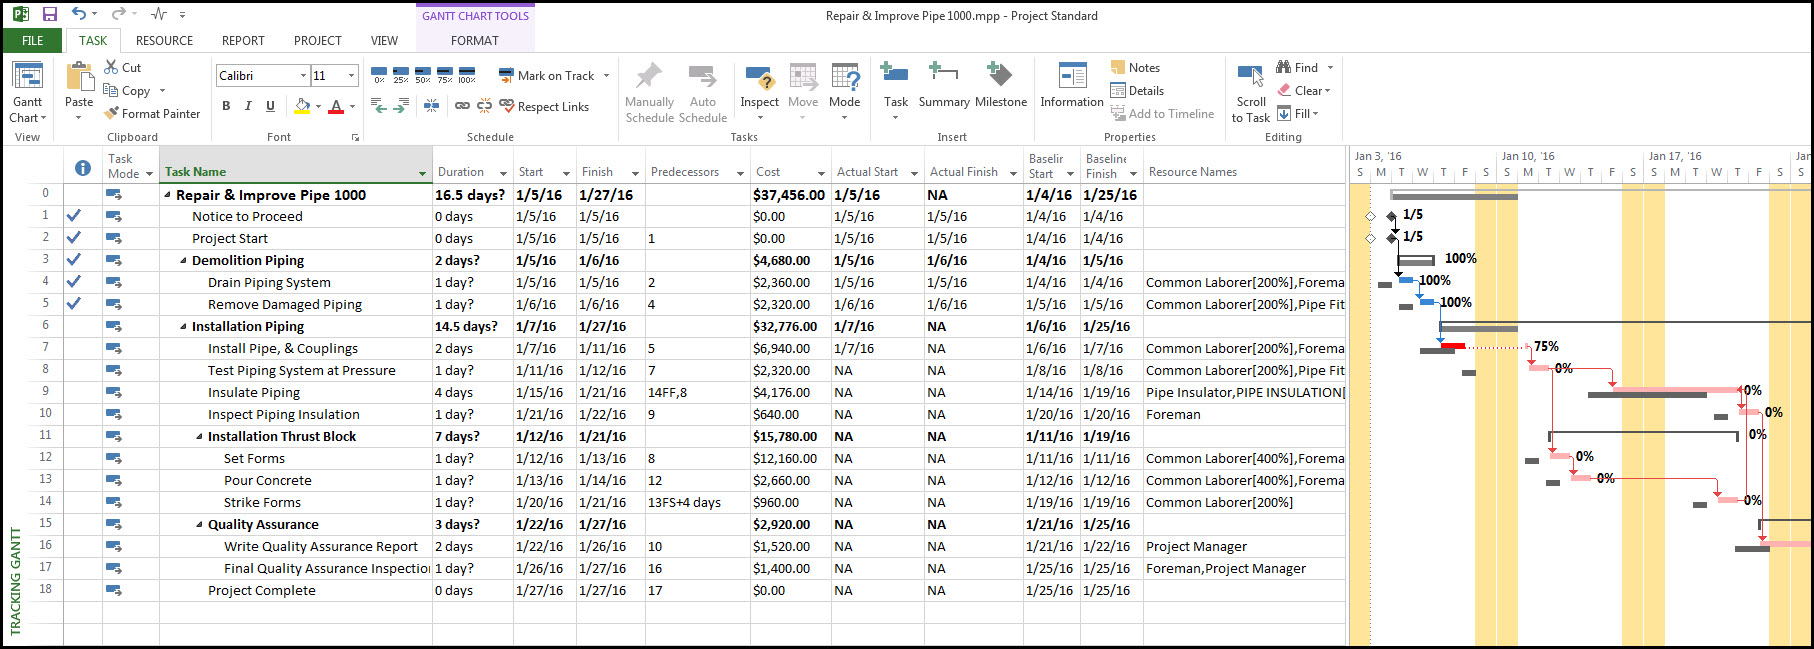
In Figure 1, is our demonstration project (‘Repair & Improve Pipe’). Our project schedule has all of its tasks, deliverables, and logic defined, along with material and labor resources assigned. The baseline is set and the project has progressed by a week.
 Figure 1
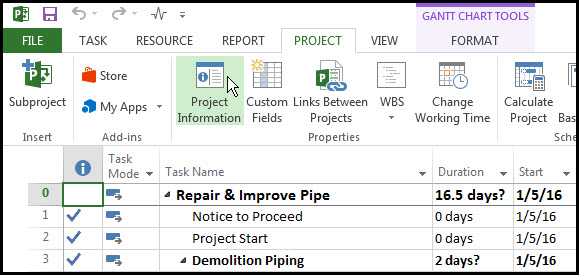
We want to analyze the project statistics; project start and finish, duration, work and costs to check that our project is on track. First, we select the ‘Project’ tab and ‘Project Information’ from the ribbon to display our project statistics, as shown below in Figure 2.
Figure 2
Once we have selected ‘The project Information’ we can click on ‘Statistics’ and our project statistic summary data is displayed in Figure 3, ready for us to analyze.
Figure 3
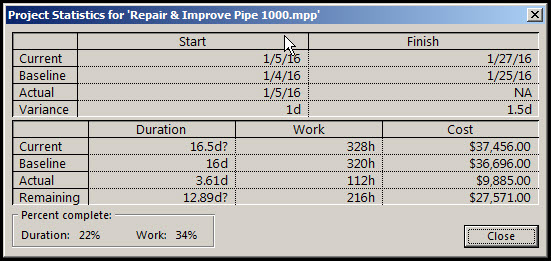
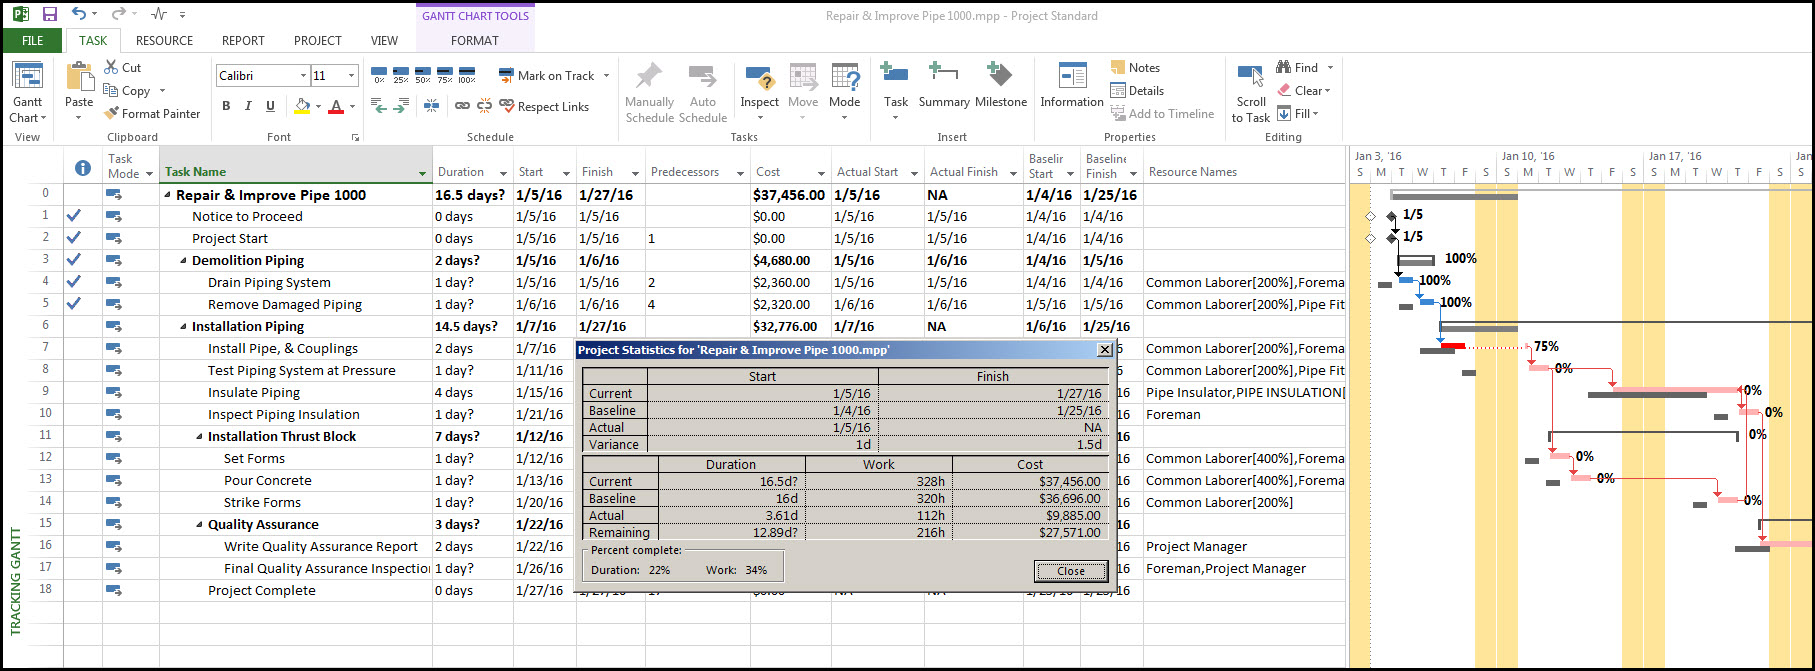
We can see from the ‘Project Statistics for our Repair & Improve Pipe’ that after one week our schedule is behind. Our project start date of January 5th differs from our baseline start of January 4th which has resulted in a one-day variance on the project start and there is also a variance on the finish date of 1.5 days.
On closer inspection, we can see that the current baseline is 16.5 days whereas our baseline duration is 16 days. We want to keep a close eye on our ‘Current’, ‘Baseline’ ‘Actual’ and any ‘Variance’ during our project so we decide to add the ‘Project Statistics’ to our ‘Quick Access Toolbar.’
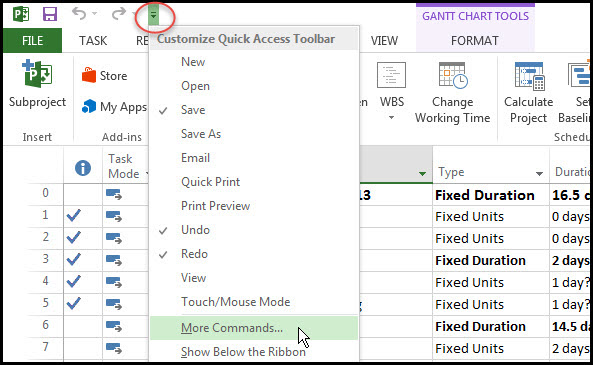
To insert the ‘Project Statistics’ icon into our Quick Access Toolbar we must first select the ‘Customize Quick Access Toolbar’ which is found left of the ribbon, adjacent to the ‘Redo’ icon. Once located we scroll down the ‘Customize Quick Access Toolbar’ and select ‘More Commands’, as shown below in Figure 4.
Figure 4
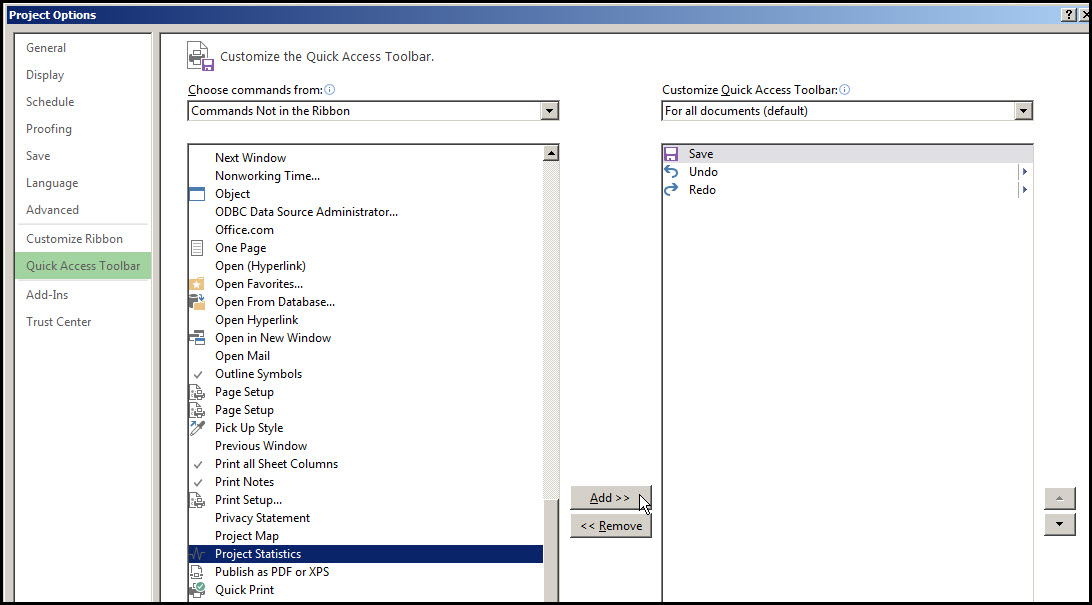
In ‘Project Options’ we select ‘Commands Not in the Ribbon’ and scroll down the list to select ‘Project Statistics’, as shown in Figure 5.
Figure 5
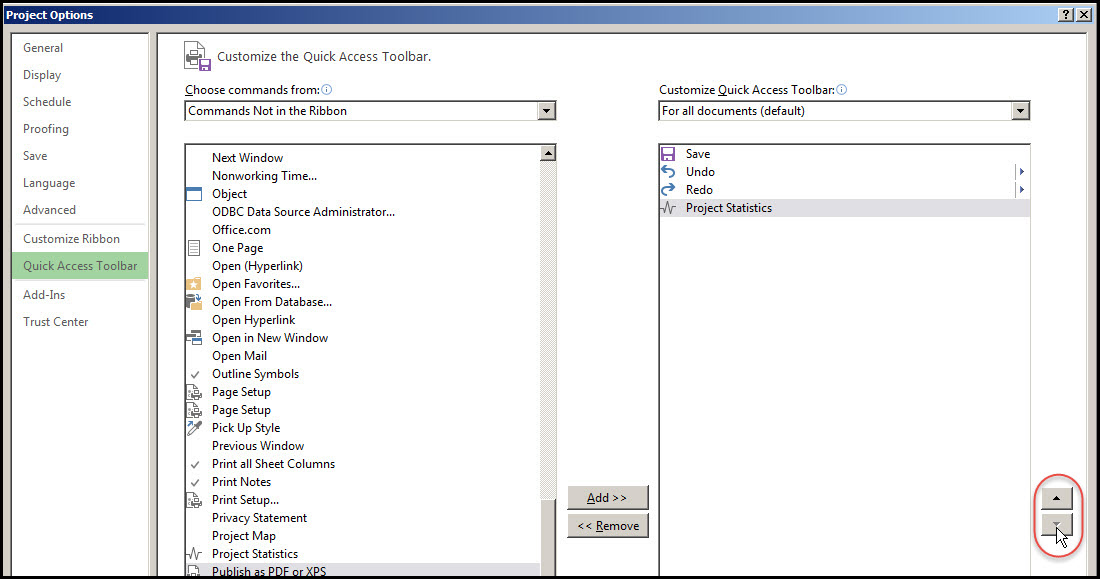
When we click ‘Add>>’ our ‘Project Statistics’ appears on the right-hand side of the ‘Project Options’ dialog box under our ‘Customize Quick Access Toolbar’. We can use the up and down arrows on the far right to position our ‘Project Statistics’ on our ‘Quick Access Toolbar’ as shown below in Figure 6.
Figure 6
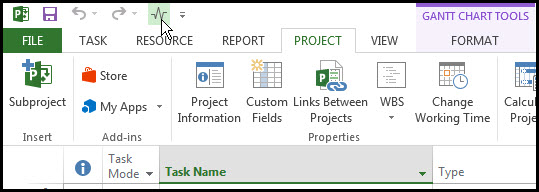
Our ‘Project Statistics’ icon now appears in our ‘Quick Access Toolbar’ next to the ‘Redo’ icon where we positioned it, as shown in Figure 7.
Figure 7
And when we click on it our ‘Project Statistics for our Repair & Improve Pipe’ project they are displayed as shown in Figure 8.
Figure 8
Summary
As we have demonstrated, Microsoft Project offers users more than one way to access a feature. The Microsoft Project Quick Access Toolbar can save users valuable time when doing repetitive work. It is also a versatile feature that allows users to switch icons and modify it whenever they need too.