The Projects tab in Primavera P6 EPPM provides the primary pages for creating and managing projects. Beneath the Projects tab, in the ribbon are seven pages; Enterprise Project Structure, Activities, Team Usage, Assignments, Issues, Documents and Risks.
In this article we will explore three of the pages; EPS, Activities and Team Usage.
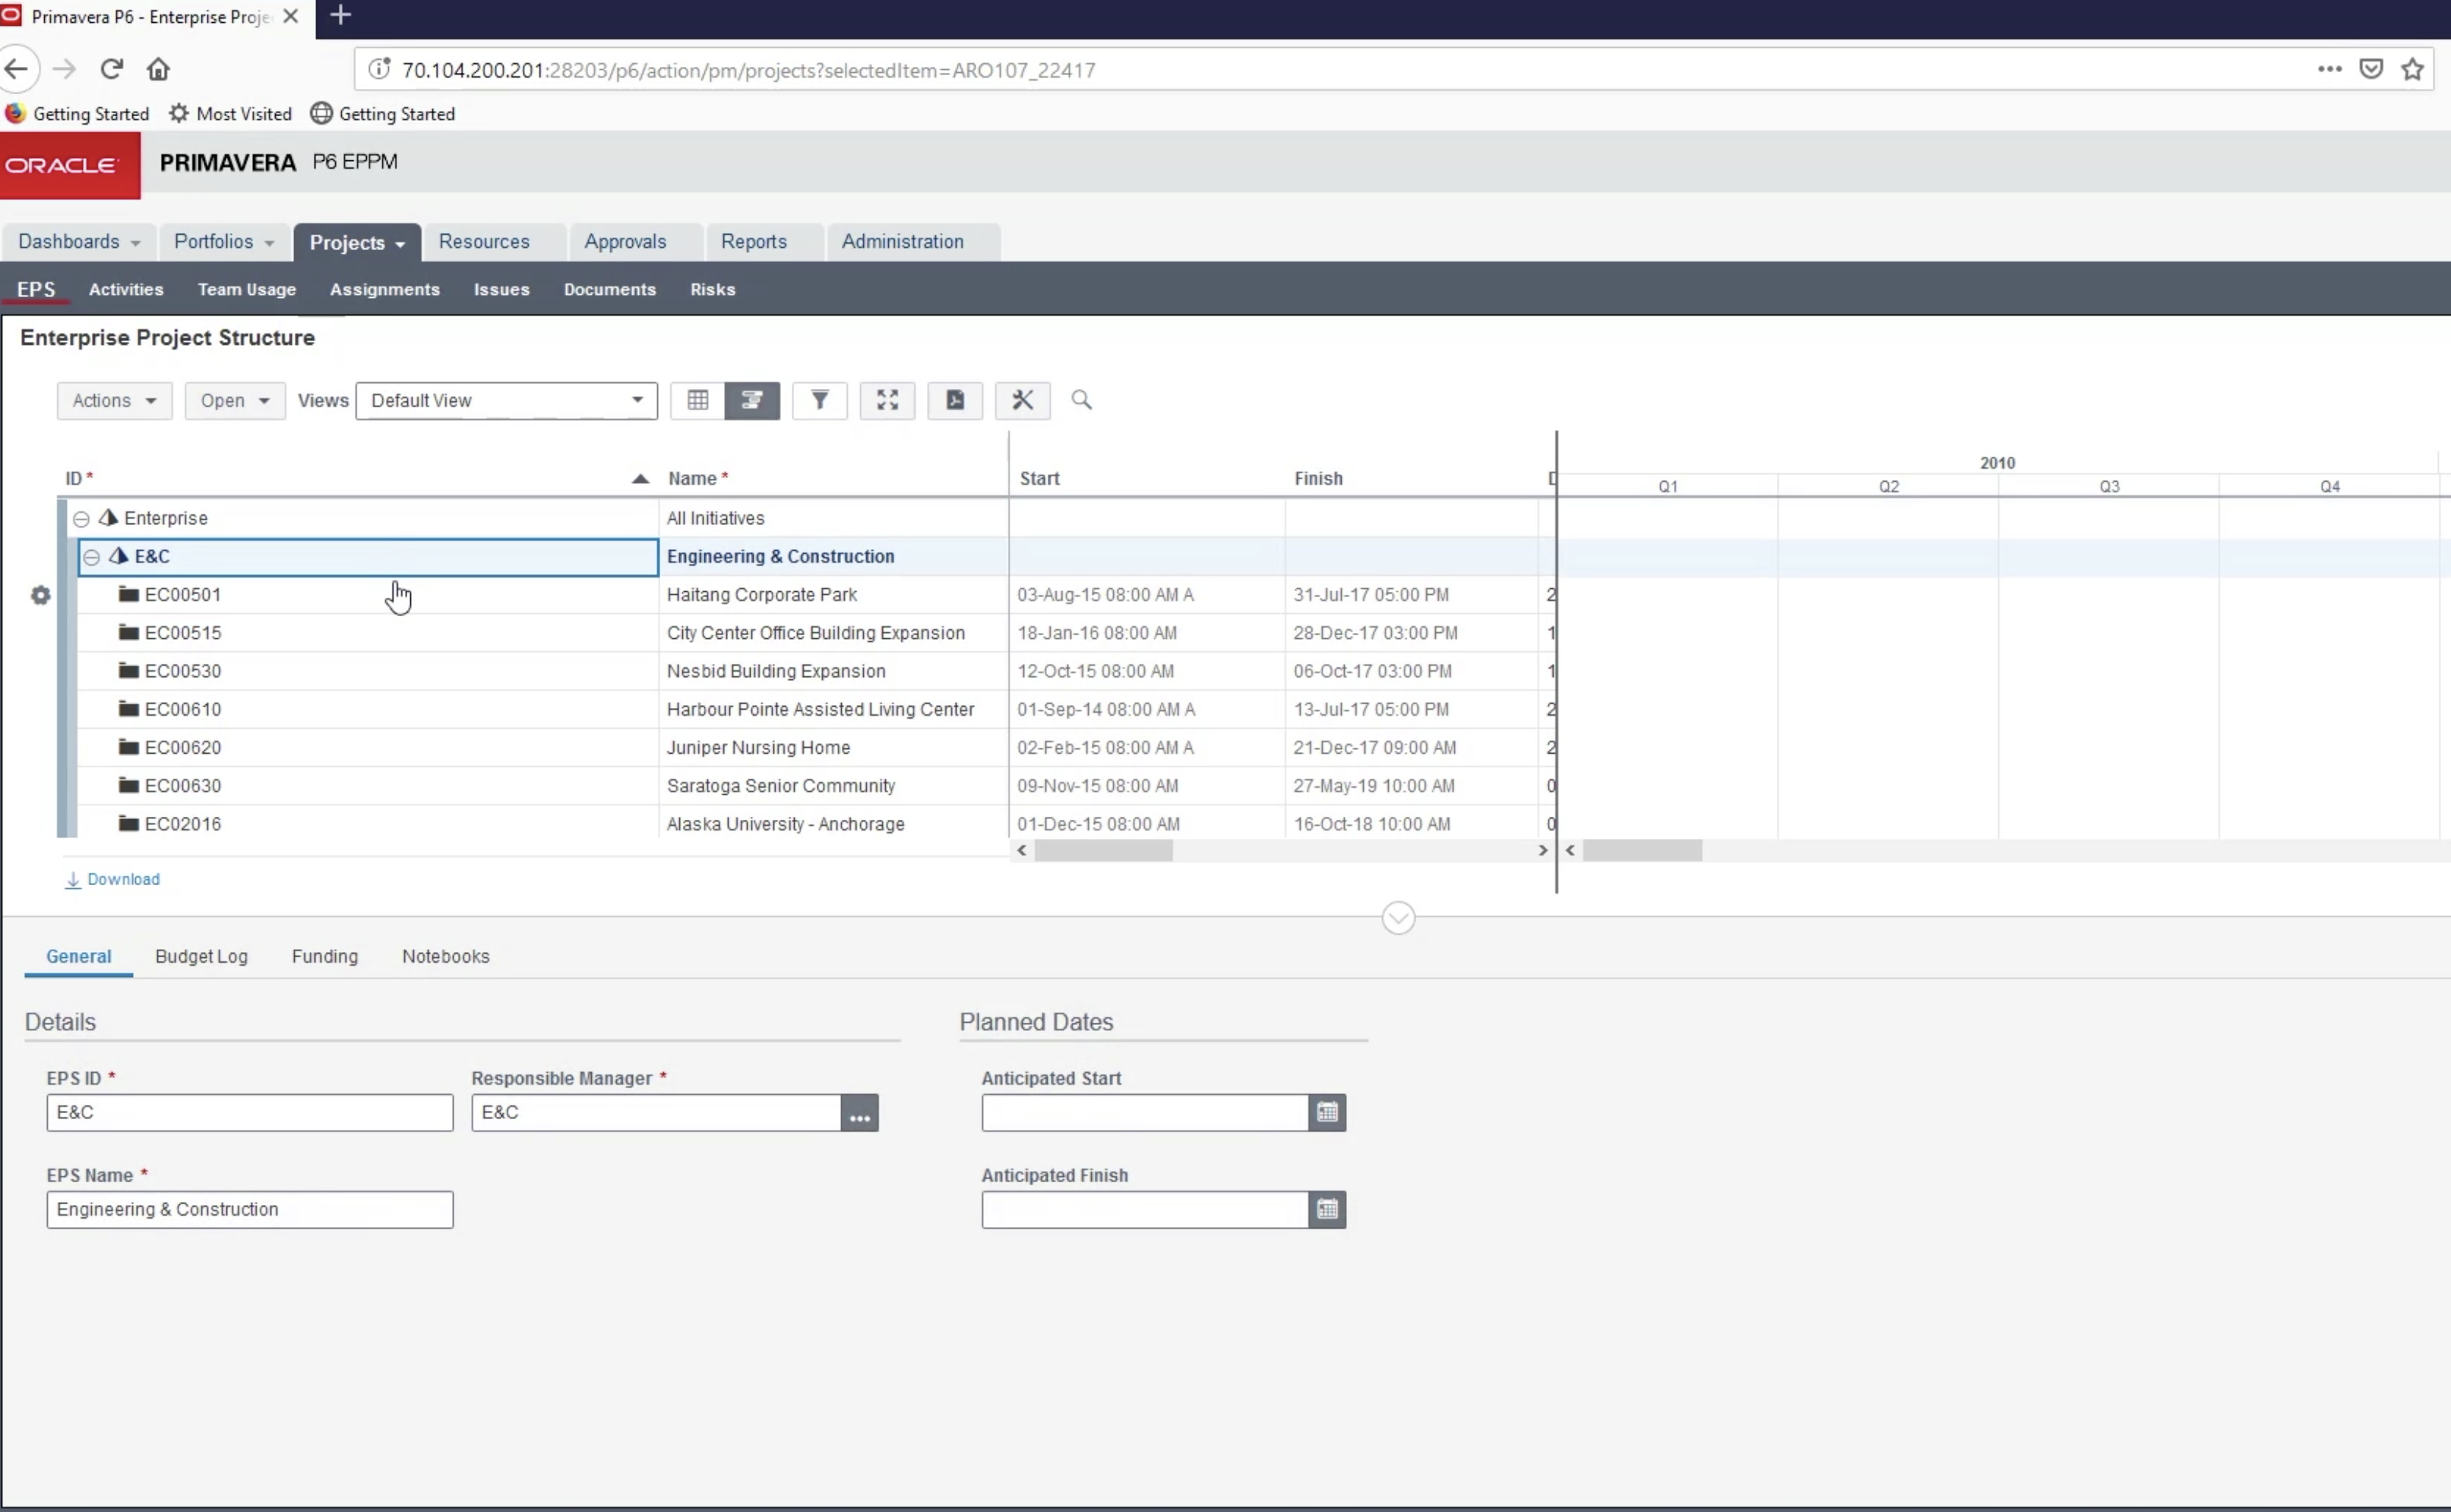
When we enter the Projects tab in Primavera P6, the first page displayed is the ‘EPS’. We left-click on the gear next to Enterprise and expand the EPS table, which consists of nodes and within the nodes are folders with each folder representing a project as shown in Figure 1.
 Figure 1
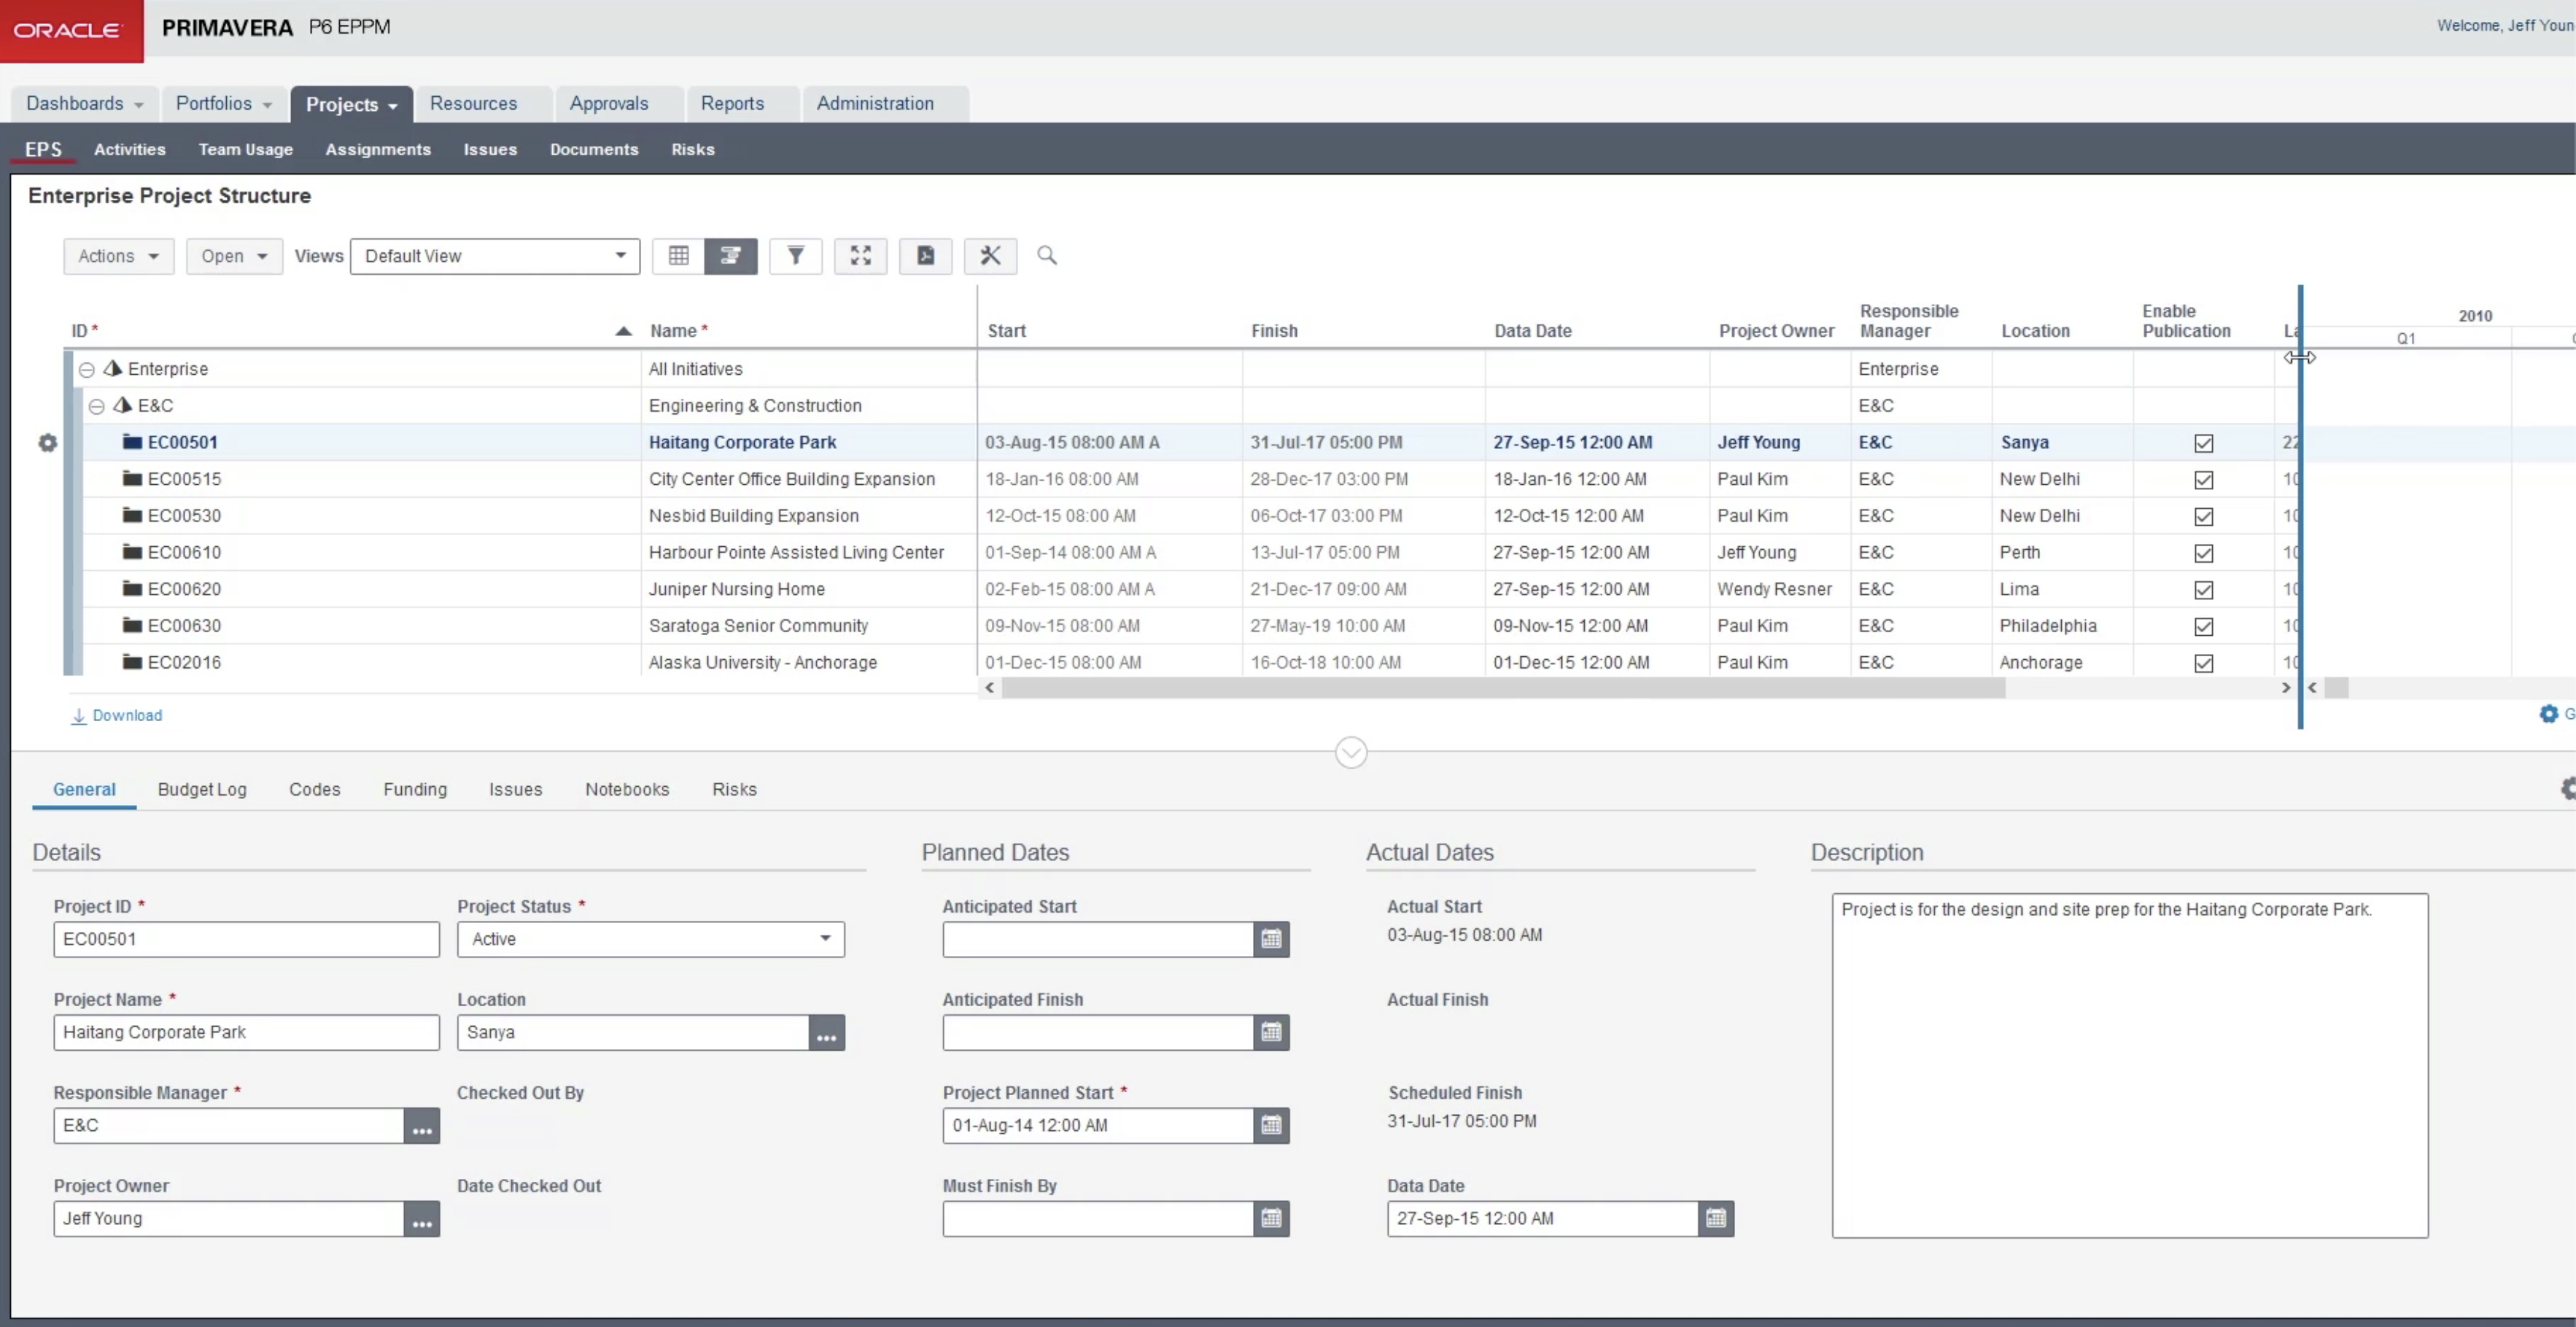
When we scroll down the folders of projects in the ‘Engineering and Construction’ node, and slide the blue vertical bar to the right on the table next to the project folders, we can see a wealth of data pertaining to each respective project, as shown below in Fig 2.
Figure 2
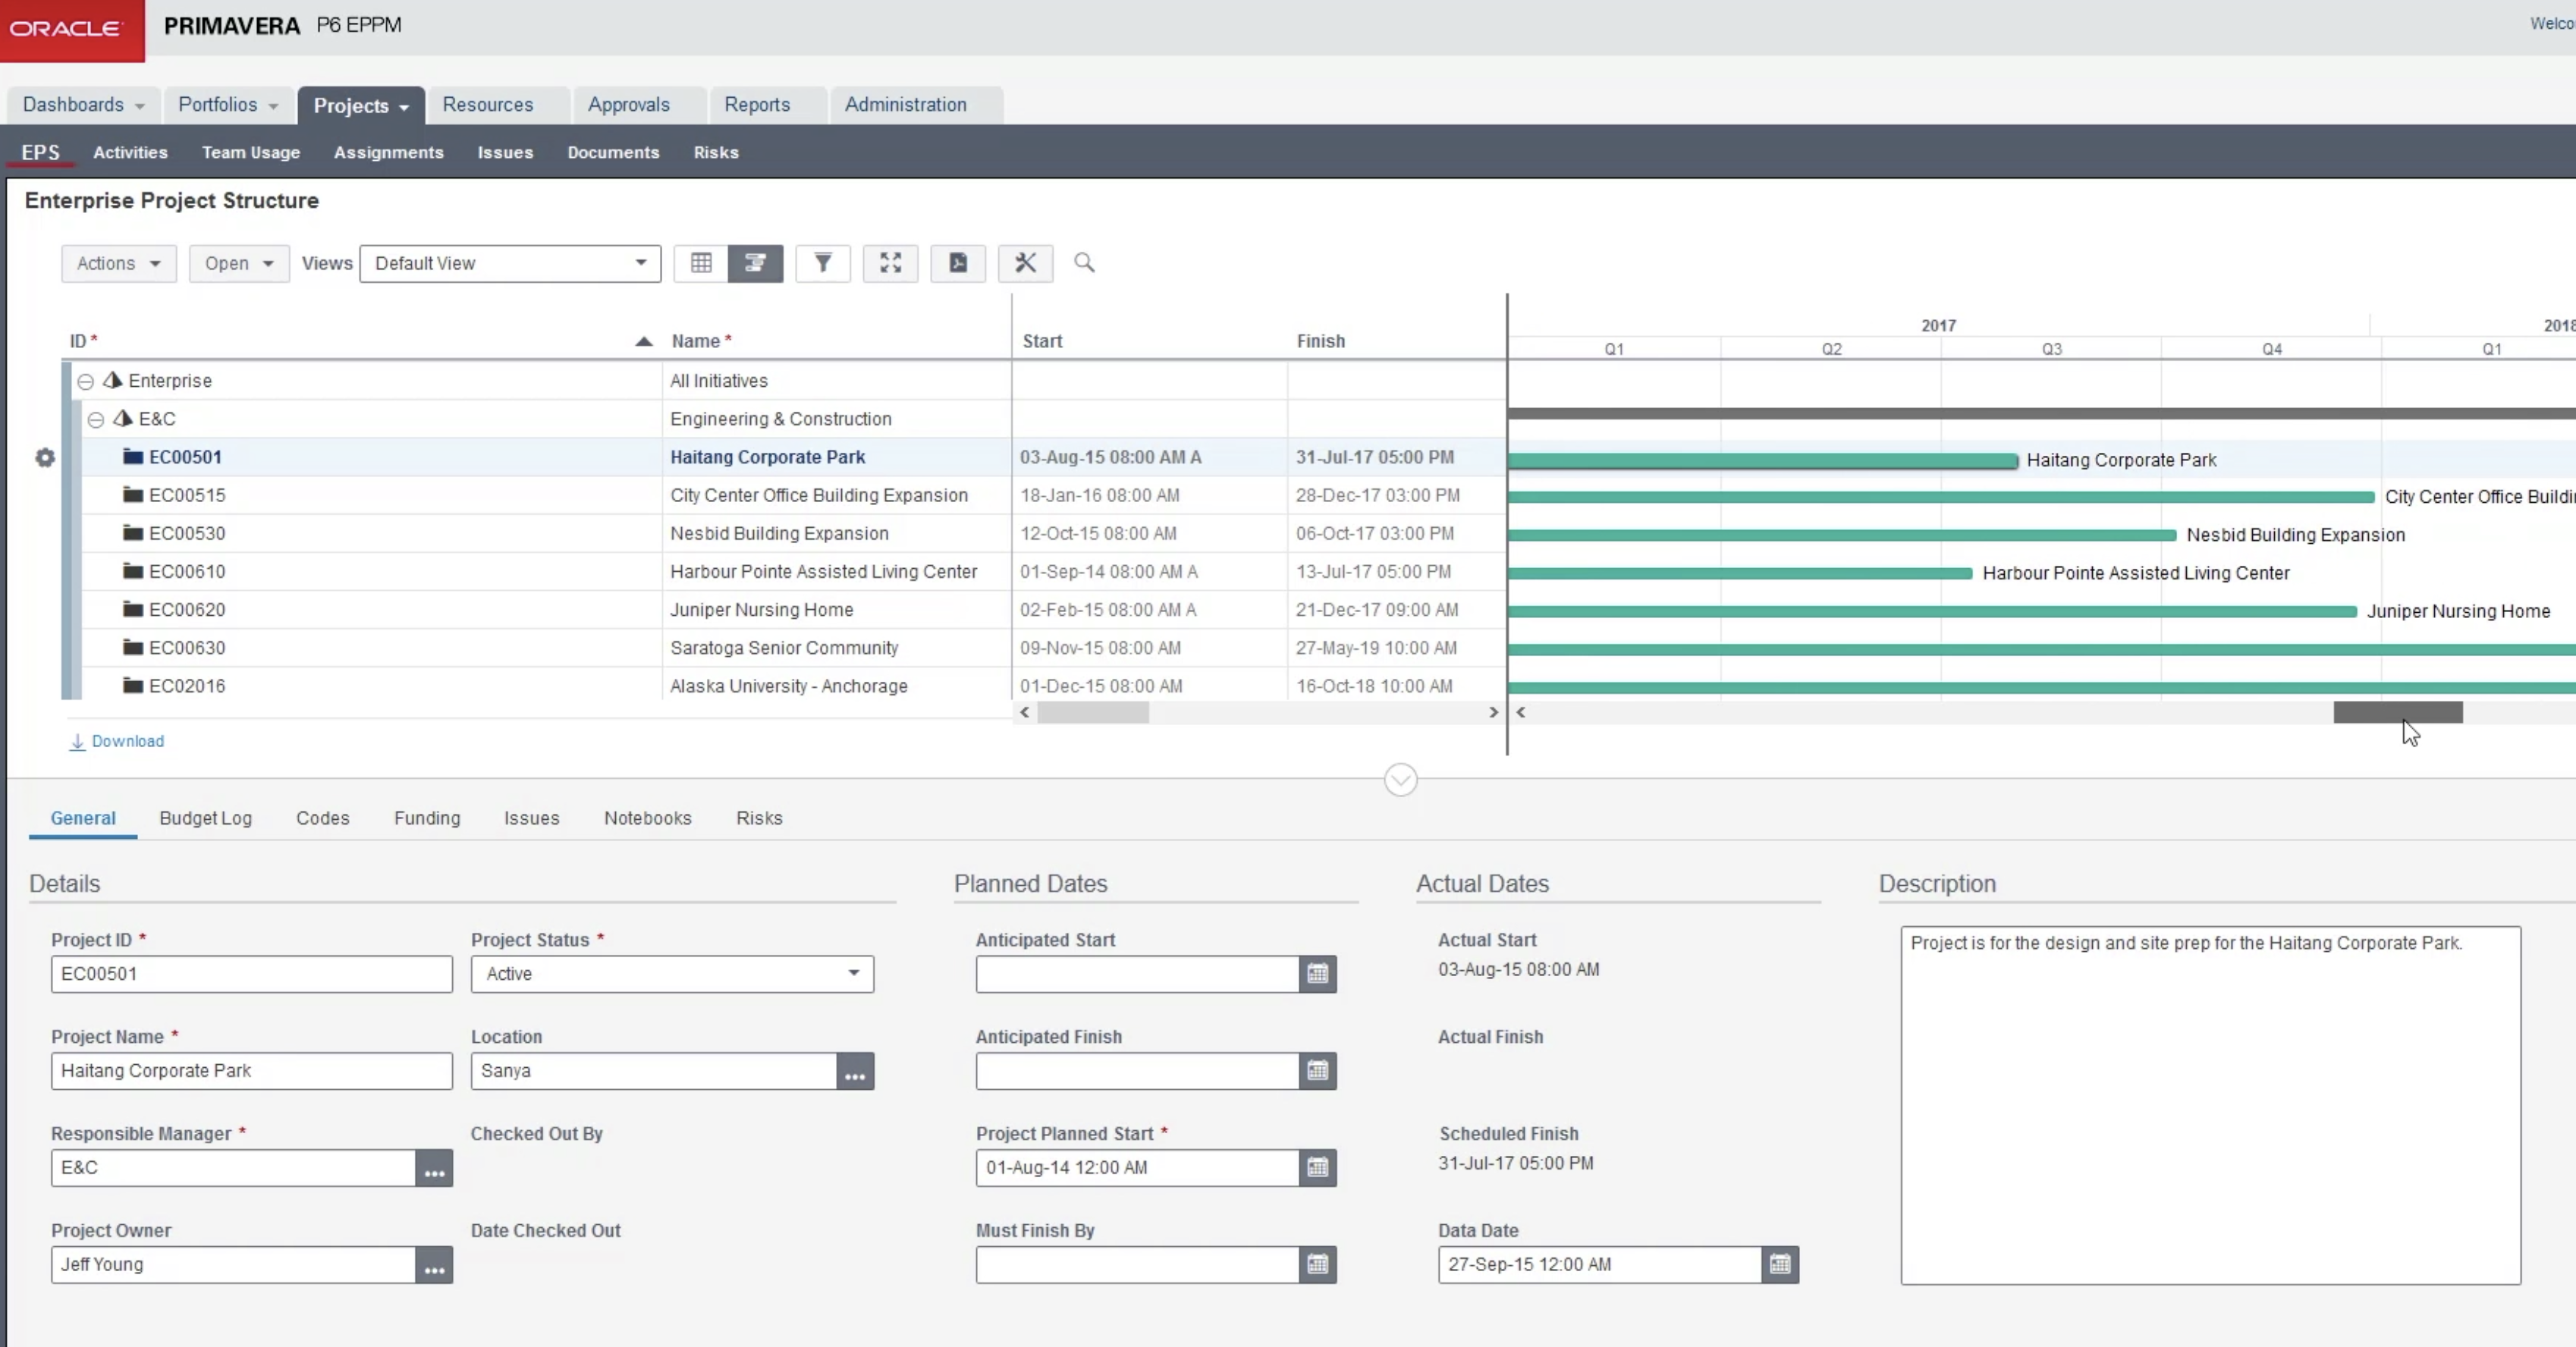
Next to the data table on the far right of the screen is the Gantt chart. By using the scroll bar, moving it to the right our projects are all displayed on the Gantt Chart. In the bottom screen we can view additional data about the currently selected project, ‘Haitang Corporate Park.’ There are seven areas of data we can view; General, Budget Log, Cost Funding, Issues, Notebooks and Risk, as shown in Fig 3.
Figure 3
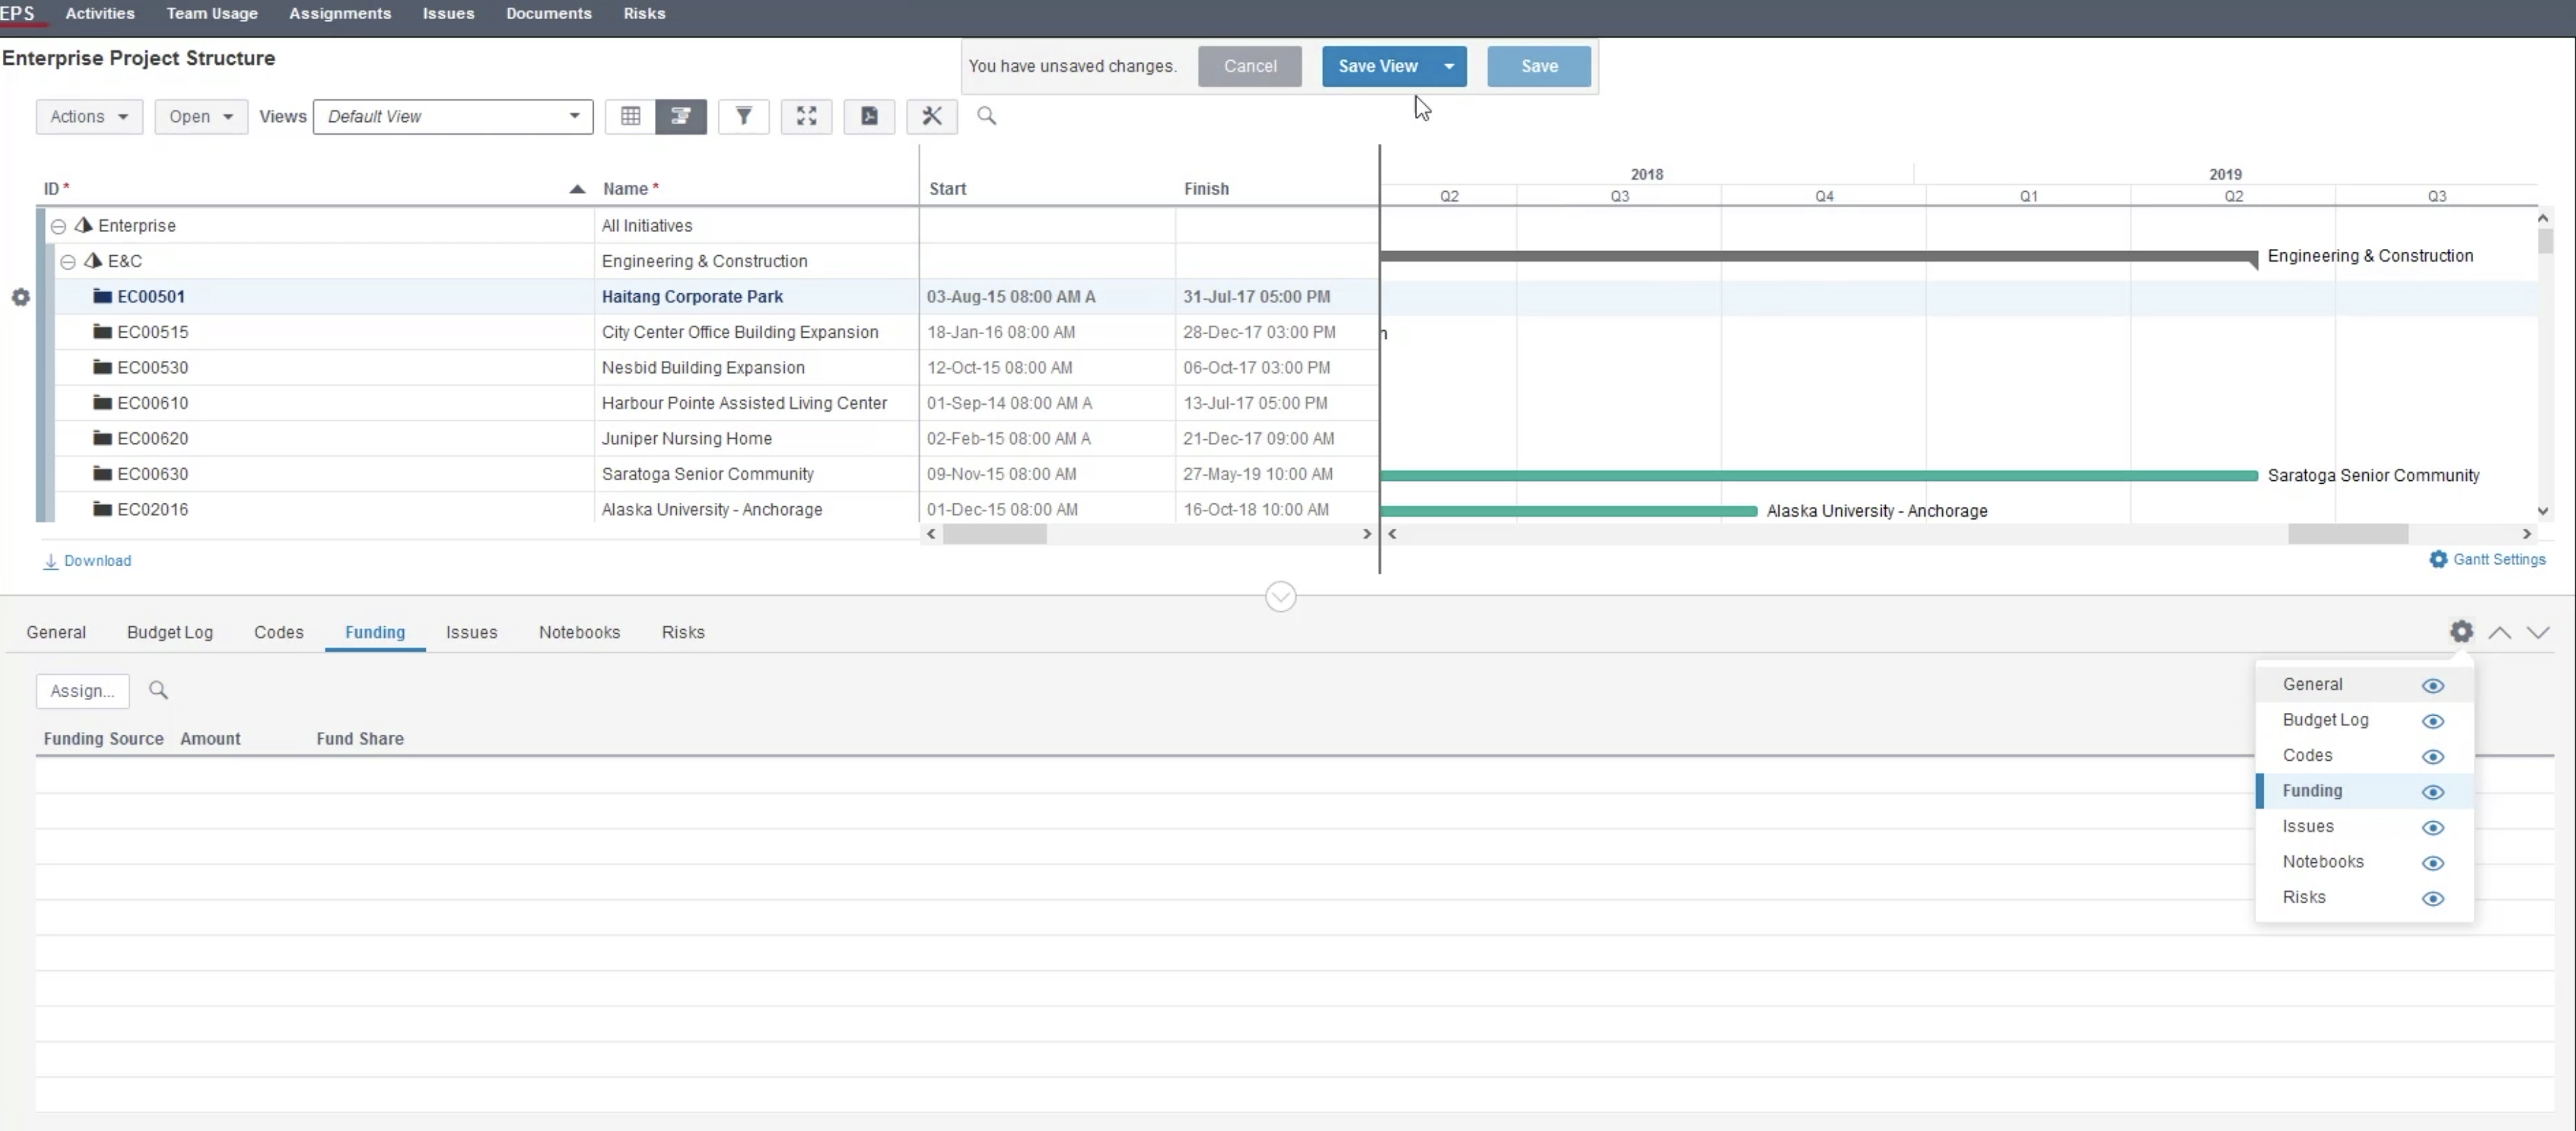
When we click on the gear on the right-hand side of the bottom table, we can scroll down to select these pages (General, Budget Log, Cost Funding, Issues, Notebooks and Risk). We can choose to hide them from view and save our choices at the top of the screen as shown below in Figure 4.
Figure 4
Next, we select the ‘Haitang Corporate Park’ project and by clicking on the gear adjacent to it we scroll down and open the project. We select the ‘Activities’ tab in the ‘Projects’ ribbon, as shown in Figure 5.
Figure 5
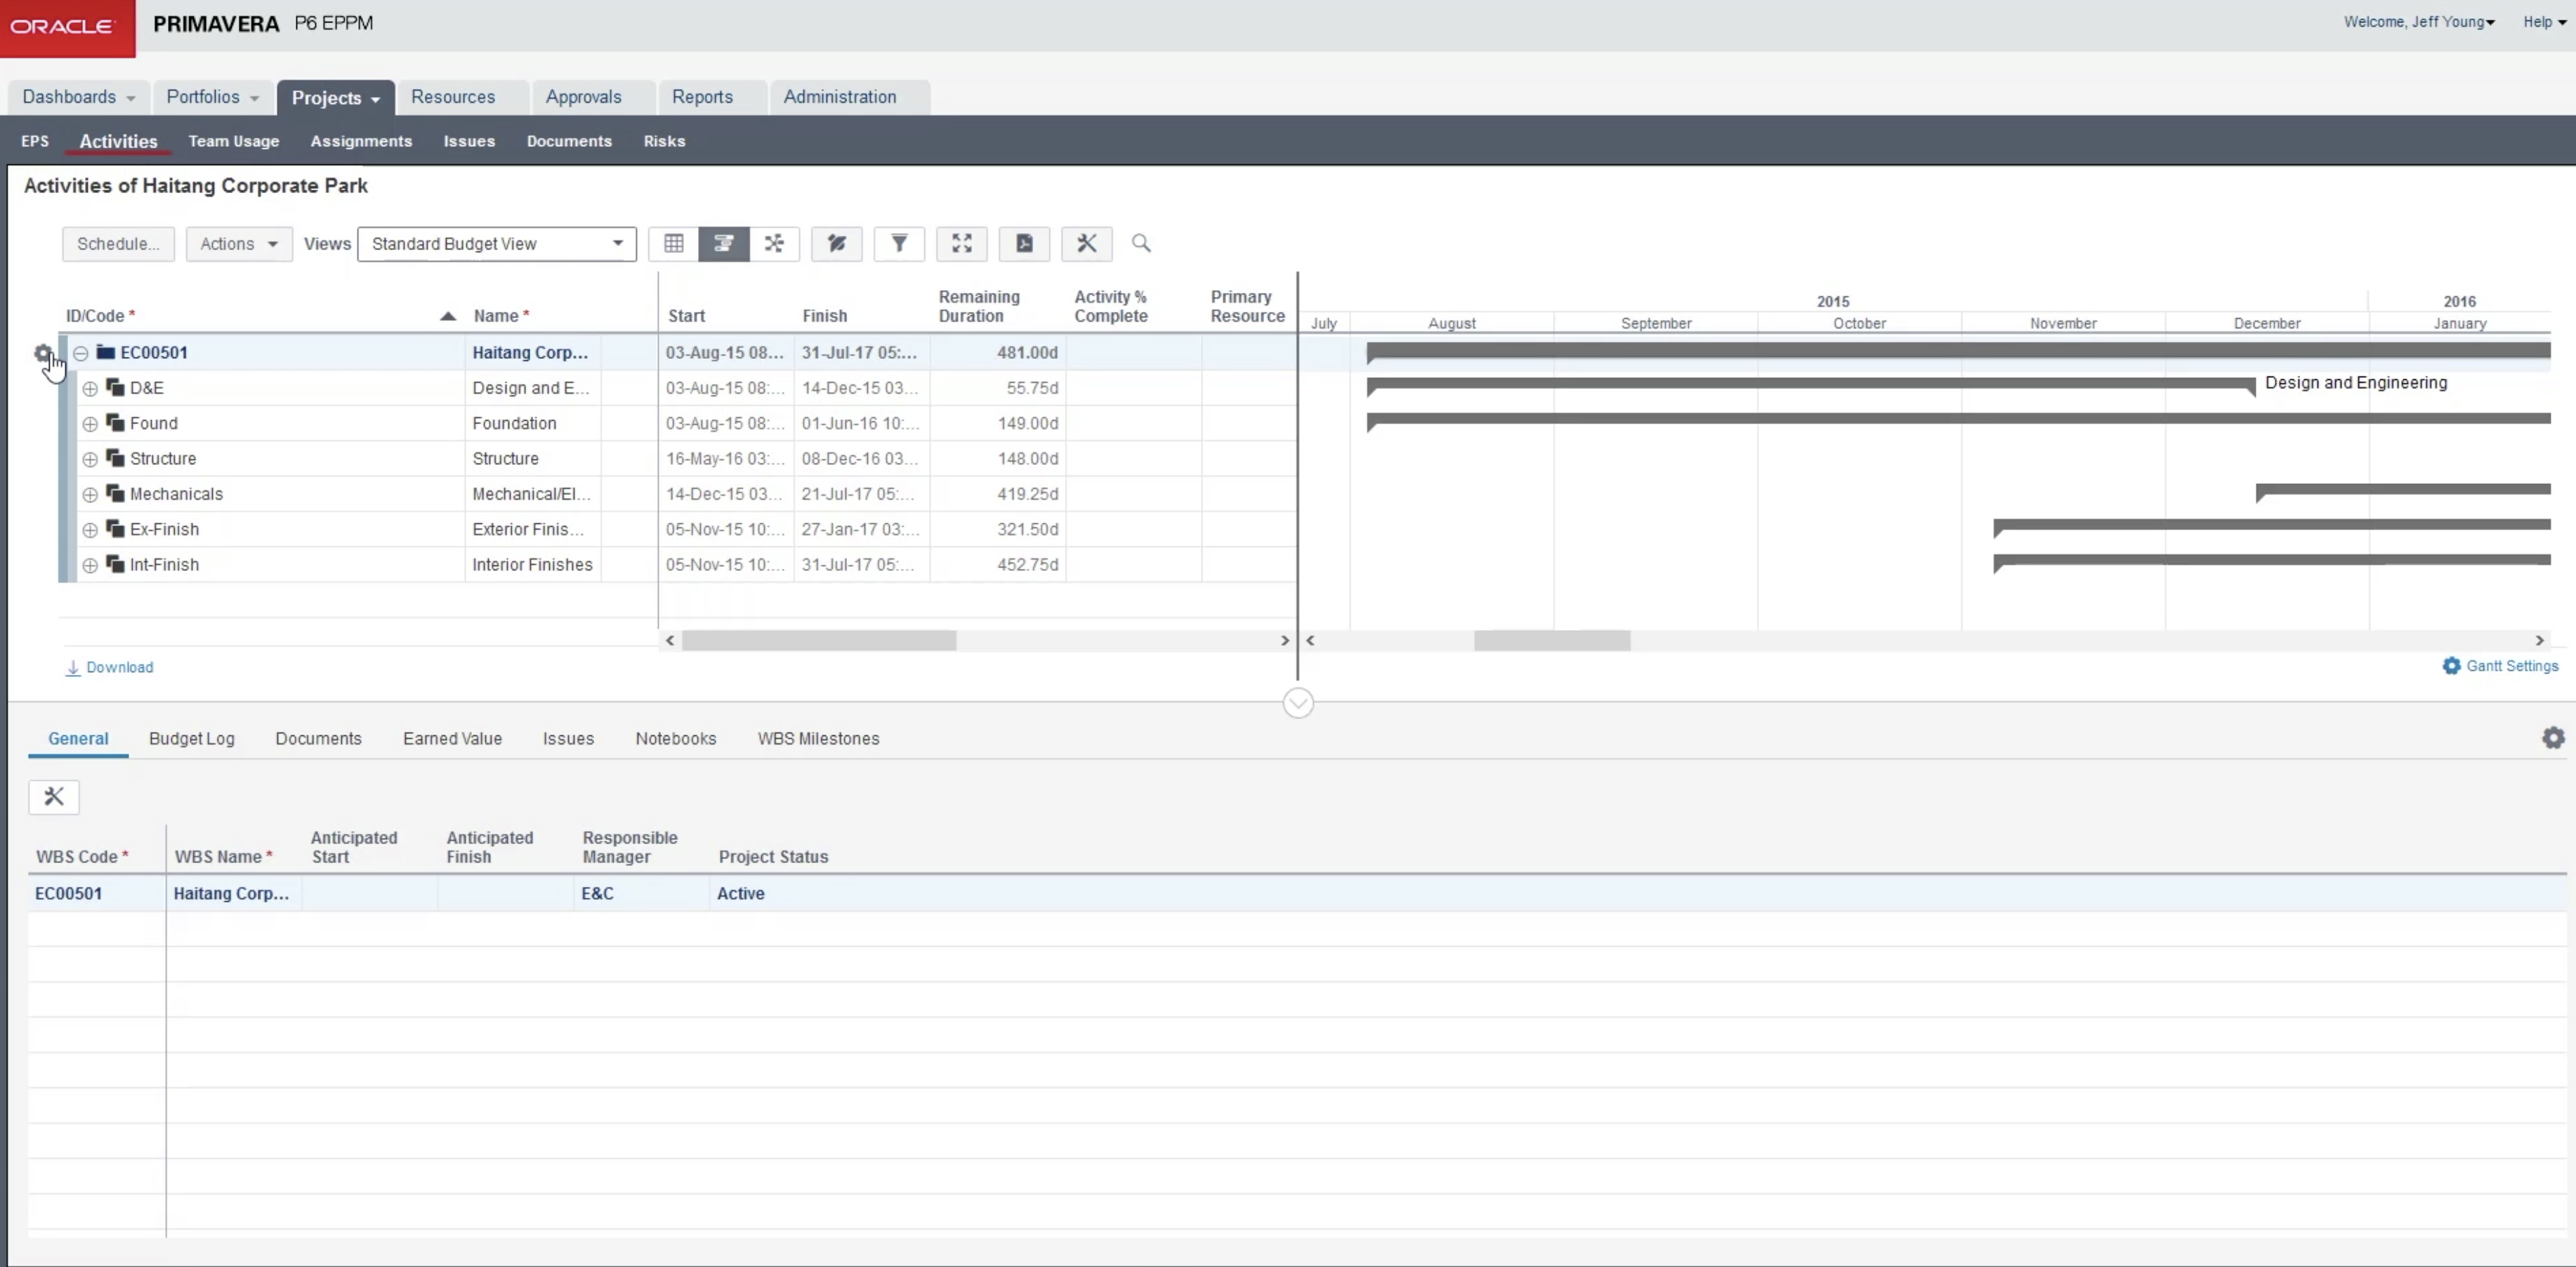
The ‘Activities’ page is the primary view used to manage the project work-breakdown structure elements i.e. deliverables, related activities, milestones and resource assignments. We left-click on gear next to ‘Haitang Corporate Park’ and an activity table appears that consists of work break down structure elements or deliverables as shown in Figure 6.
Figure 6
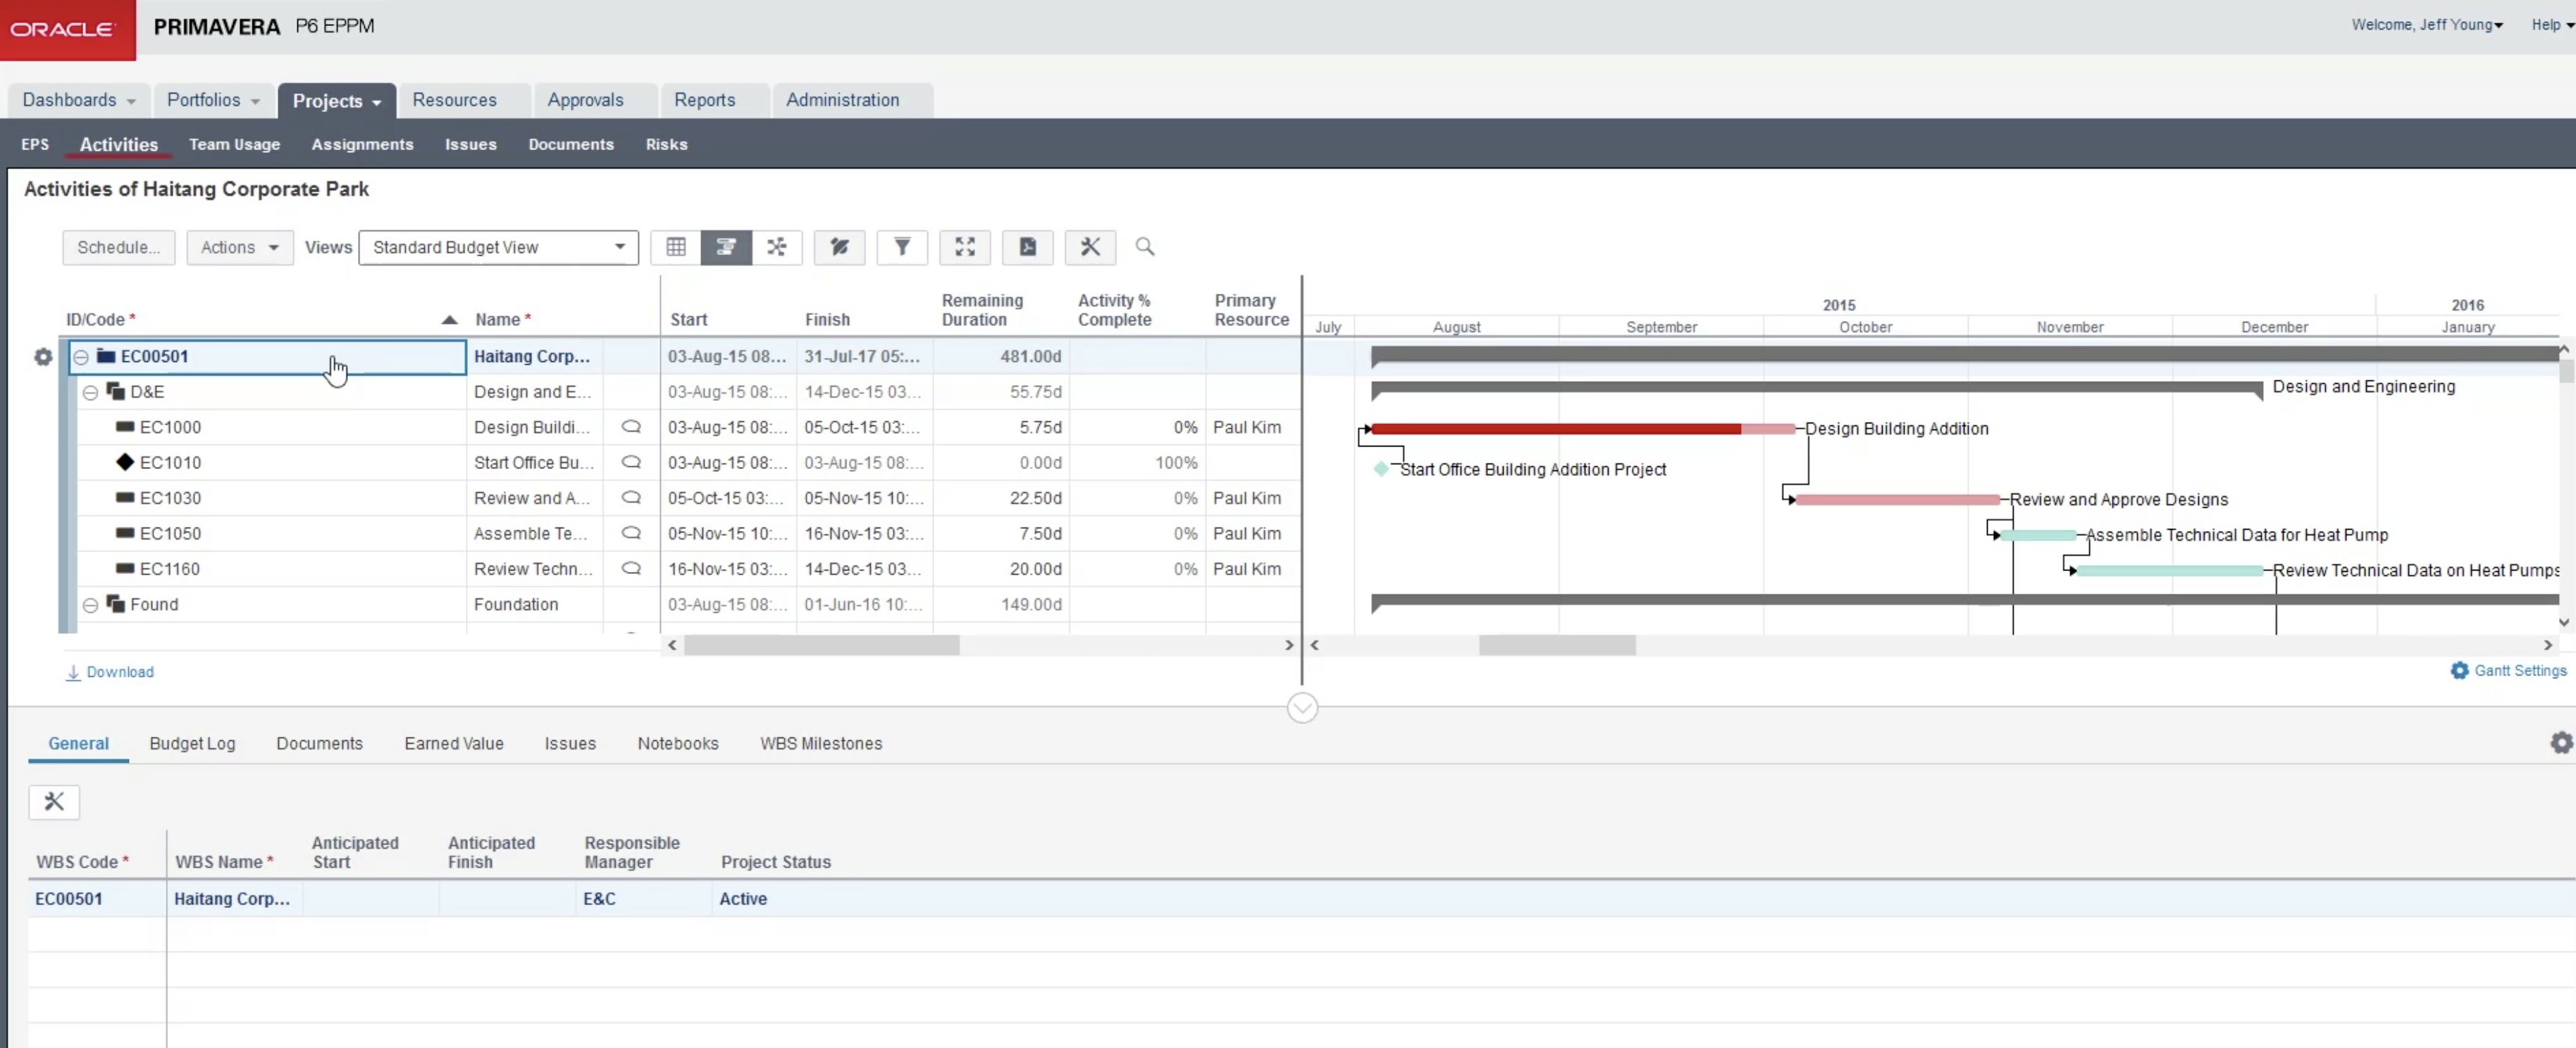
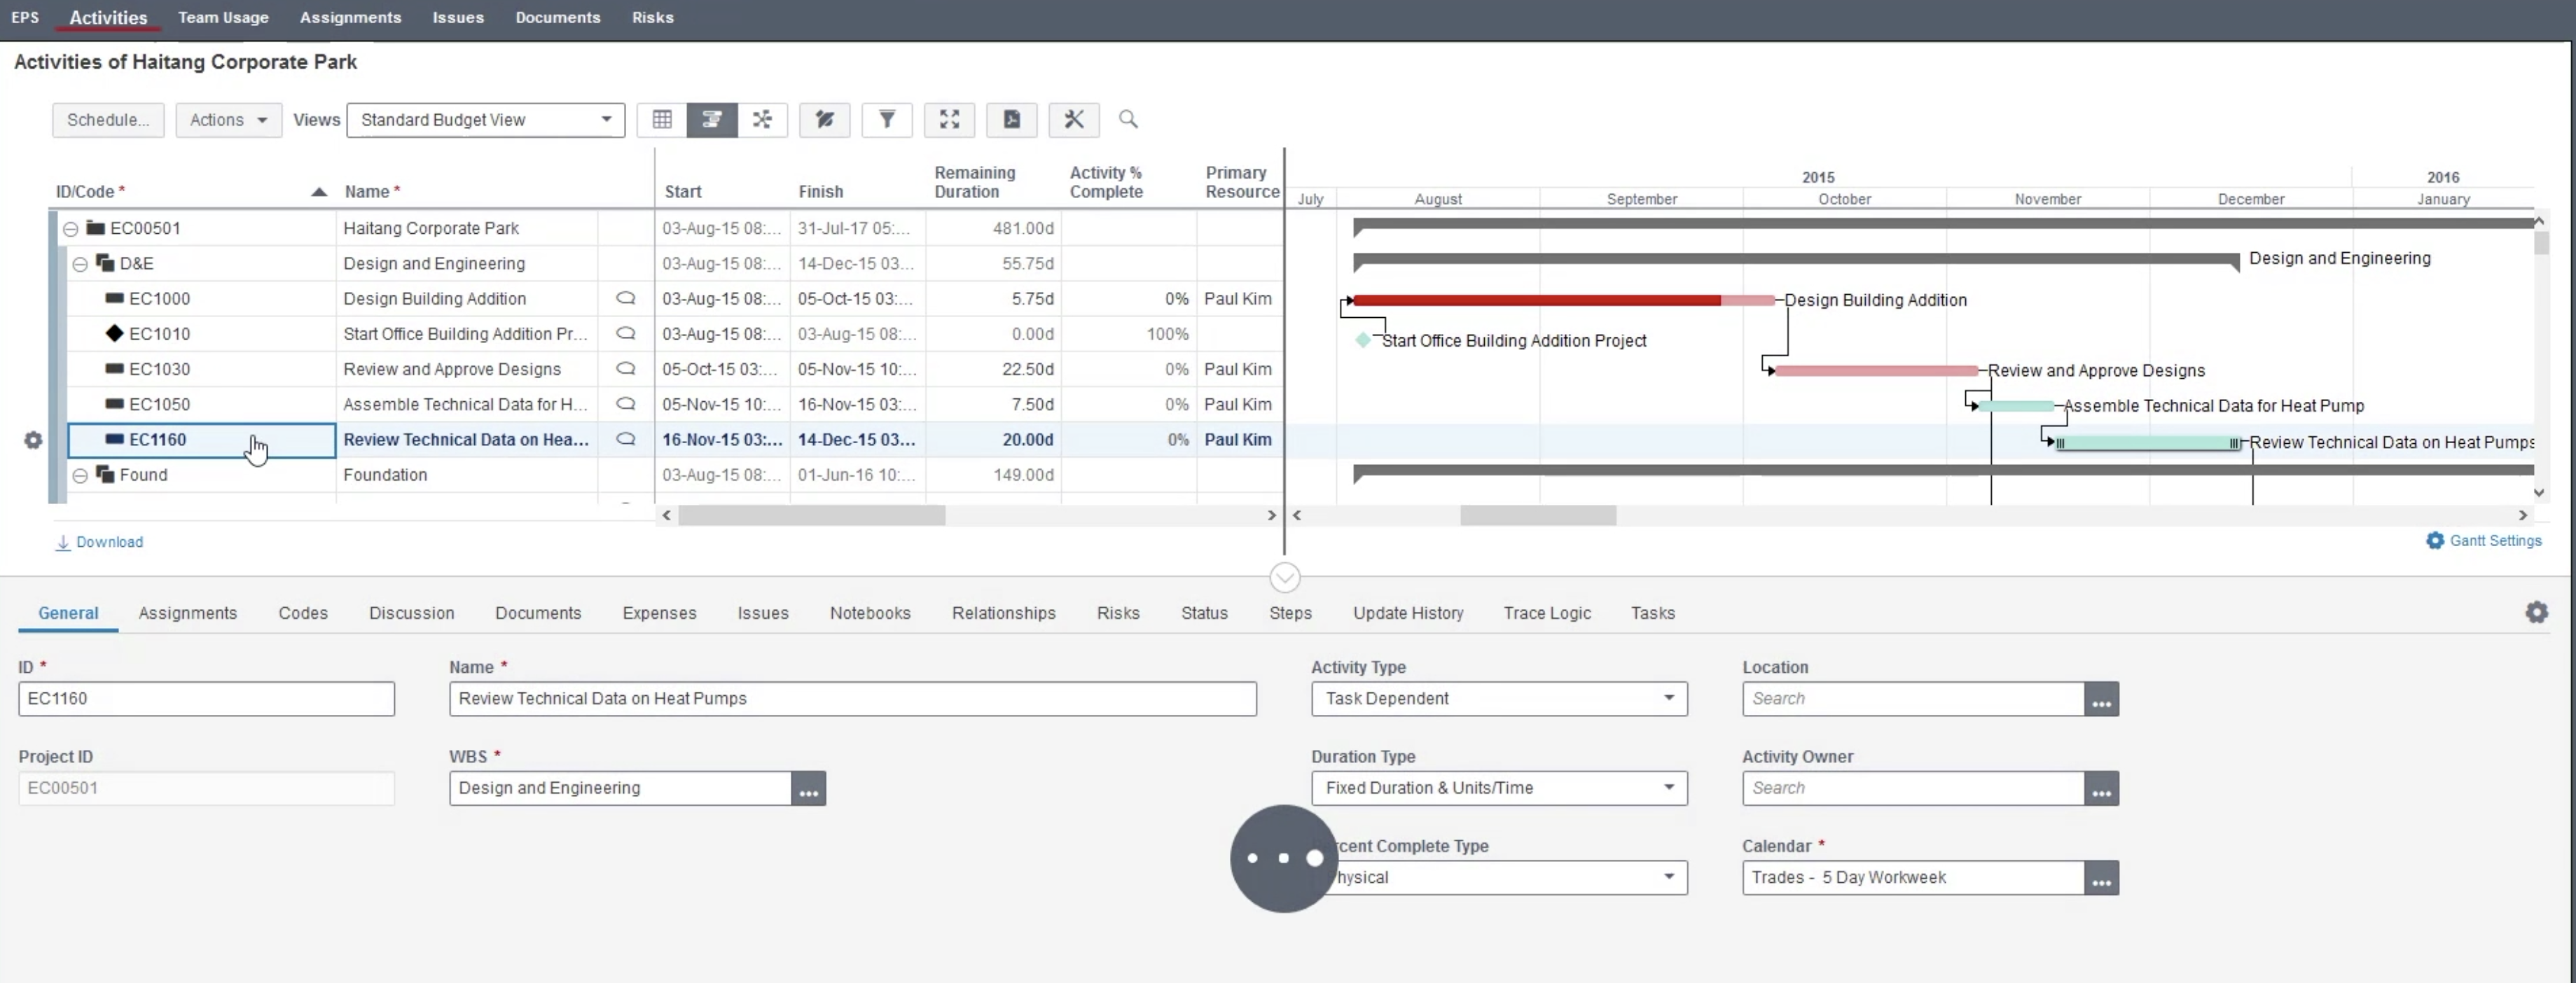
On the right-hand side is the Gantt chart that displays activities, relationships and milestones. The bottom screen, details data provides information about each activity when we scroll down our activities list. If we were in Work Breakdown Structure (WBS) additional details would be provided about these elements in the bottom screen, as shown in Figure 7.
Figure 7
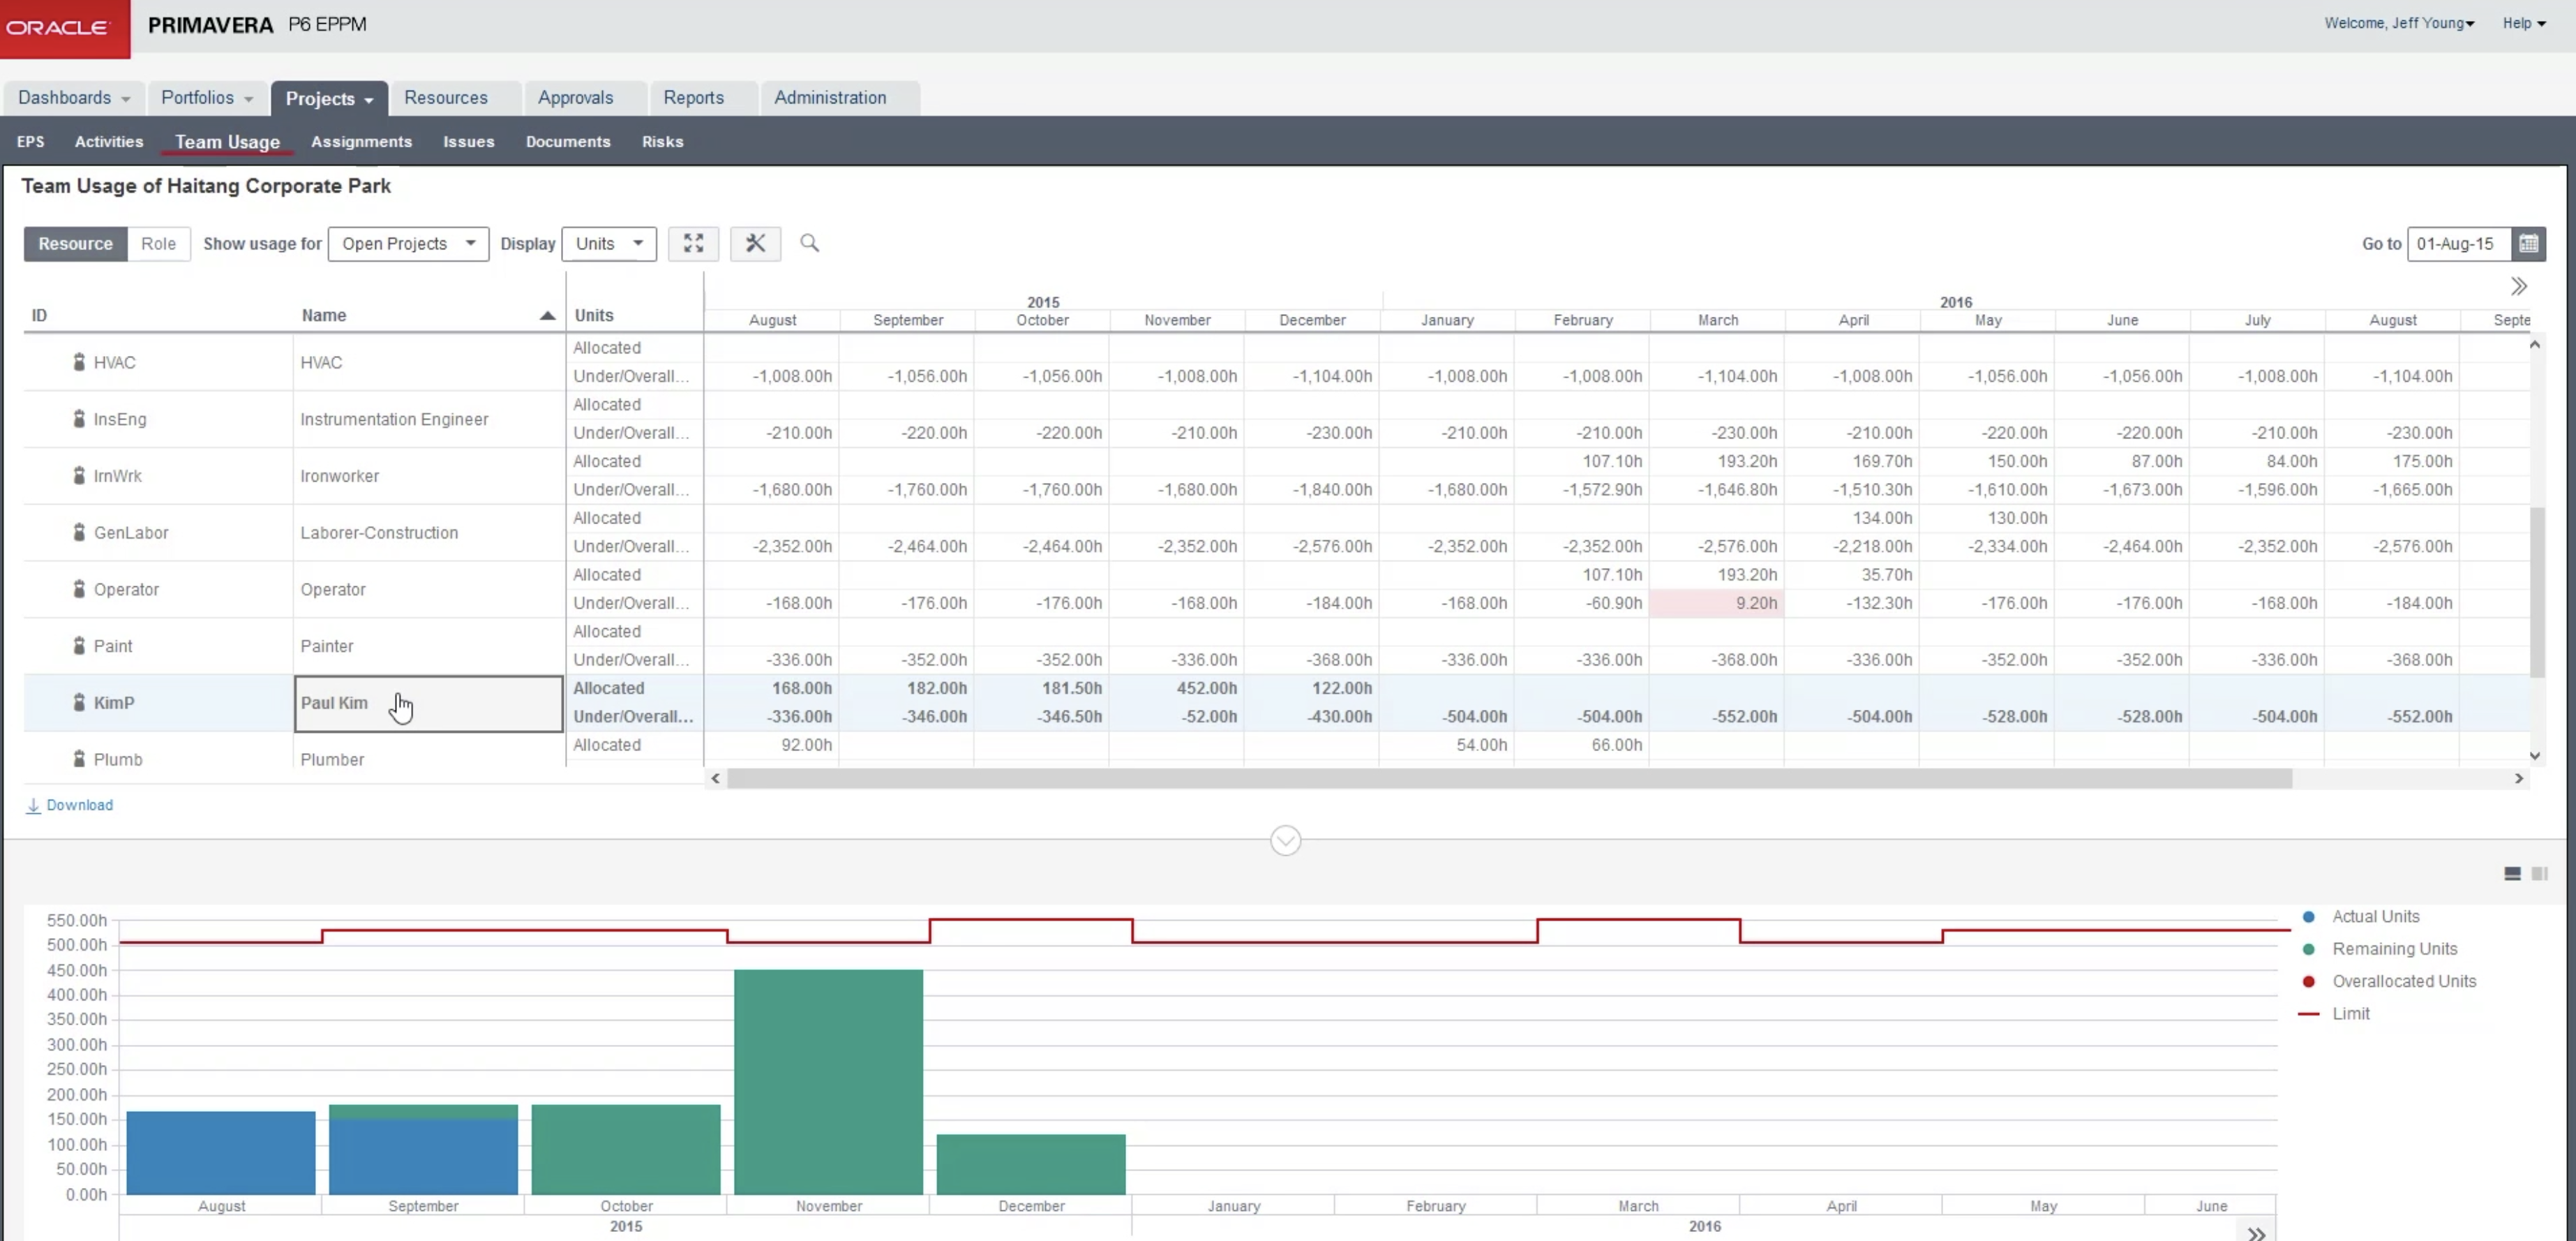
When we select the ‘Team Usage’ tab in the ‘Project’ ribbon and expand a project we can view the selected resources for that open project. The usage of the resources is displayed as a spreadsheet and histogram as shown in Figure 8.
Figure 8
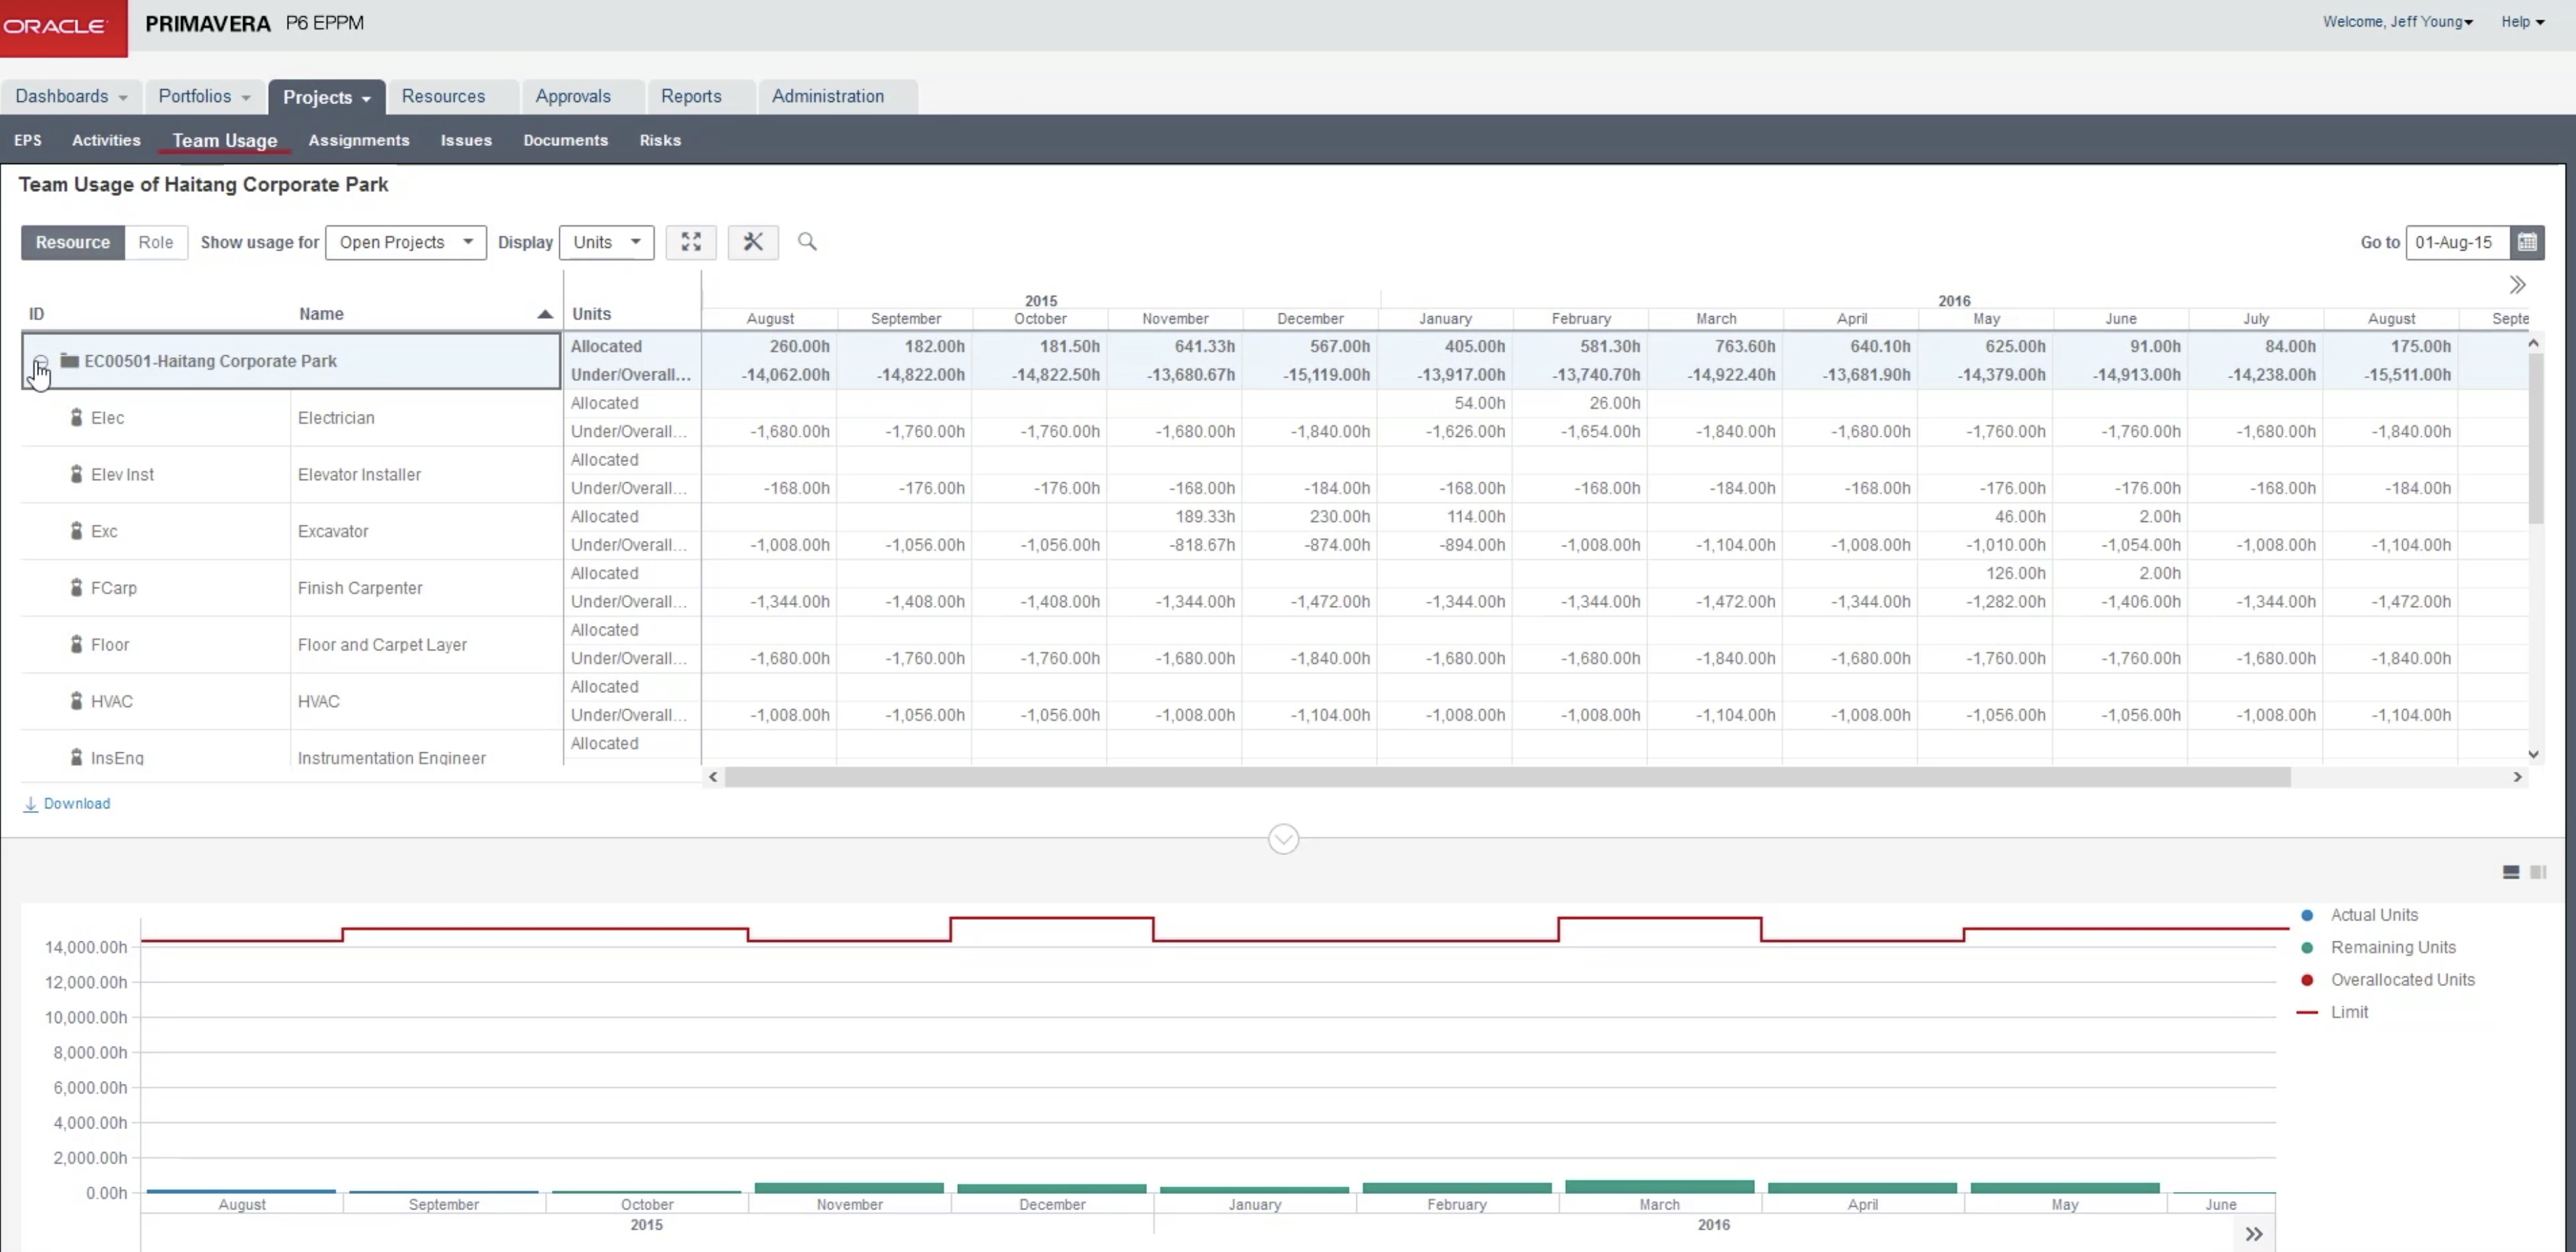
We scroll down and select ‘Paul Kim’ to see how his work is progressing and how it is planned for the future. The blue bars on the histogram, in the bottom screen represent actual hours, work that has already taken place and the green bar represents remaining work. The Red line is the limit line. If ‘Paul Kim’ goes over the limit line he will be over-allocated and the histogram bar will turn red, as shown in Figure 9.
Figure 9
Summary
The Projects tab in Primavera P6 EPPM provides the primary pages for creating and managing project information. There are seven different pages associated with the Projects tab. We have discussed three of the pages in this article.
- The EPS – is the first page displayed when you enter the ‘Projects’ tab. It consists of nodes, within the different nodes are folders, each folder represents a project. There are 3 different areas of information, data is stored adjacent to the projects list, the Gantt chart displays the progression of each listed project and lastly the bottom screen provides additional data when a project is selected. You can hide additional data from view.
- Activities – is the primary view used to manage the project work-breakdown structure elements of deliverables, related activities, milestones and resource assignments. You can view activities related to a project in a table when you open a project. The Gantt chart displays the relationships and milestones for the related activities. The bottom screen provides information about each activity when selected.
- Team Usage – all resources are listed for an open project. If a resource is selected you can see how the resource’s work is progressing and how it is planned for the future. The histogram displays the resources actual hours worked, remaining hours left and offers a warning ‘Limit’ line to prevent overallocation of resource hours.