 Primavera P6 is a powerful project management tool. However, having an enterprise-grade project management system is made more useful by being able to do detailed reporting using Adrega Project Intelligence.
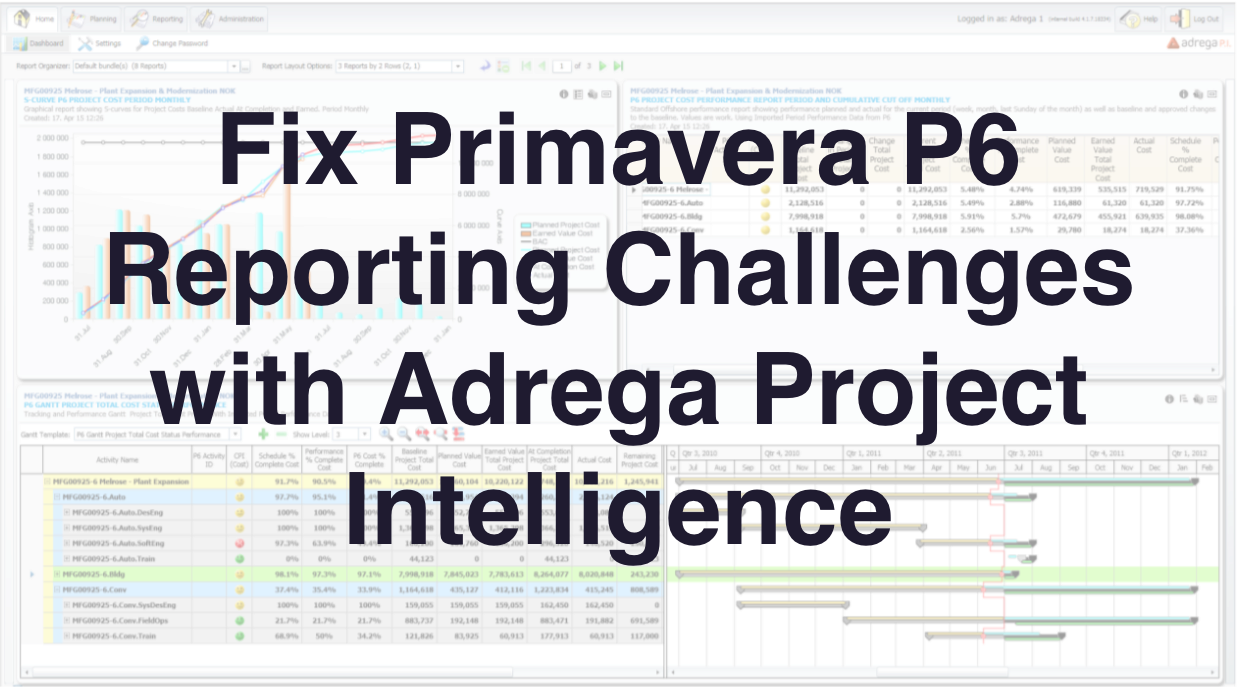
Primavera P6 has built-in options for reporting, but experienced users aren’t always able to get what they need from the system. Have you felt like that? Here are 5 challenges for project reporting in P6 and tips for how to resolve them.
We recommend Adrega Project Intelligence (Adrega PI). It’s an easy win for P6 users because it fills all the project reporting gaps and is designed to save you time.
1. Lack of flexibility
Primavera P6, like many tools, works on the basis of a set of standard reports. That’s great if you are looking for exactly what is already in the system, but not so good if you need more flexibility.
Adrega PI (Project Intelligence) is the tool we recommend to sit alongside P6. Out of the box there are 15 different types of report. Whether you are looking for a Gantt chart, resource trends, pie charts, performance over time or time phased project and resources data, Adrega PI has it all.
There’s also a handy ‘compare’ view so you can see what’s new with your project. Compare the current project performance alongside the new status before you merge your changes, so you can check what impact your modifications have made.
2. Limited licensing
Can your stakeholders access P6 reports if they don’t have a license? Your PMO may not have the budget for a license for all senior managers, especially if they don’t have any other use for Primavera beyond checking out reports. P6 has limited options for distributing project reports far and wide.
There’s also the learning curve to take into account. If someone isn’t using P6 very often, they could find it difficult to remember exactly what to click to the get the reports they are looking for.
Adrega PI has a more straightforward learning curve because you’ll be able to use features you are already familiar with from Microsoft Office. For example, you can copy and paste, fill up and down and other industry standard shortcuts make it easy to navigate and use the tool.
Oh, and you can set up dashboards for executives that update in real-time so they’ll always have easy access to the latest project status information.
3. PDF report bundles
Another challenge with reporting is that it’s unlikely you want to create just one. Normally you will be running a suite of reports to give you a rounded view of what’s happening with the project. And you want to save them in PDF format so they can be shared.
It’s not easy to do that in P6, so you need to find another way to create report bundles. Are you seeing the trend? Yes, you create report bundles easily in Adrega PI.
A bundle lets you run the same set of reports against multiple projects each time the report deadline comes round, without you having to click to select each project or report. Simply select the option to output the reports as PDFs and you get one handy PDF file containing everything your project stakeholders need to know, about every project.
This is a massive timesaver and simplifies the whole process of regular reporting. Your PMO team will win back time in the day to do value added tasks, like interpreting the data and making recommendations instead of simply running the reports.
4. Lack of quality and consistency
Manual reporting relies on someone being there to run the report, selecting exactly the same parameters as they did last time, and pulling exactly the same set of projects. That’s the only way you can compare project status over time, across multiple projects.
However, that’s a huge manual effort, and it’s made worse by the expectations of different stakeholder groups. Do some of your reports need to end on a particular day, and others run weekly or at different frequencies? P6 can be a little inflexible when you want different cut-off dates for reporting, further adding to the manual overhead to make sure each report is exactly right, each time.
Adrega PI lets you standardize your reporting in a way that ensures quality and consistency. This is especially important if your company uses earned value management.
Earned value reporting is enhanced with Adrega PI because you can easily access historical time-phased data, S-curves and trend analysis.
You can set up your own views for each user and create personal dashboards. You can share filters and views with others so you don’t have to create them from scratch each time. As well as views, you can also display reports in the dashboard.
5. Integration with other tools
What we often see is that users are trying to integrate other tools with Primavera P6 so that they can export data. Trust us, trying to cut and paste or export information as a .csv so you can edit it in another app is not the answer! Integrations can be expensive and complex – and they still might not give you what you need.
Adrega PI is web-based and supports multiple users at the same time, with a range of options for reporting that you won’t find in Primavera P6. You don’t need to try to export data into any other system. Anyone in the company can use the Adrega PI functions through their browser. People can only access what is appropriate for their role so you don’t have to spend time setting up access rights for each project in P6 itself.
Primavera P6 reporting might have felt limited up until now, but you’ve just seen that there are plenty of ways you can extend its capability with one web-based tool.