Most schedule specifications require resource and cost loading. Usually, there is also a requirement to provide a cost curve. Primavera will produce a P6 cost curve, but you can also easily create one in Microsoft Excel.
There is more than one way to accomplish this. I’ll describe the method I like to use here.
I like to provide both the Primavera P6 cost curve as well as Excel curves for record. I don’t like the way the P6 curve works once I start with progress updates.
 Figure 1 – P6 Cost Curve for the Baseline Schedule
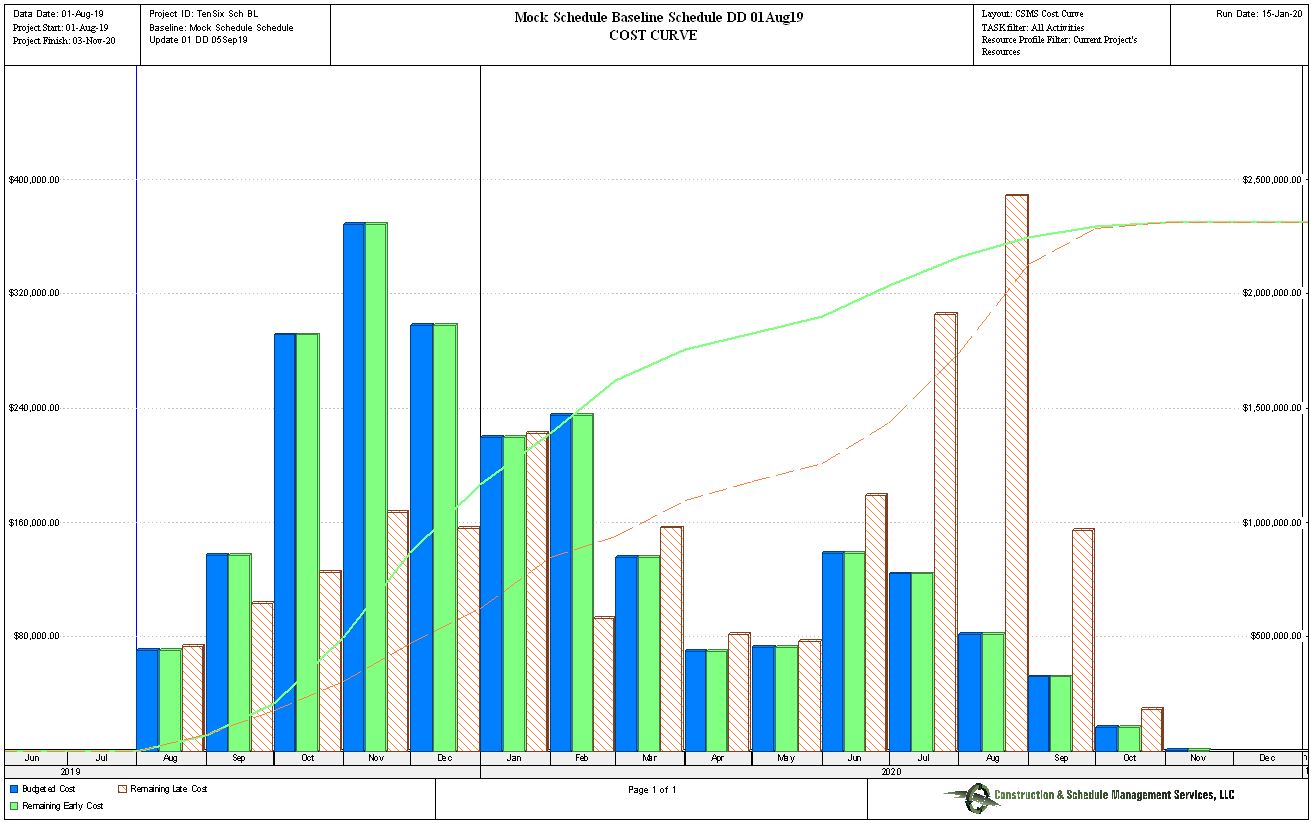
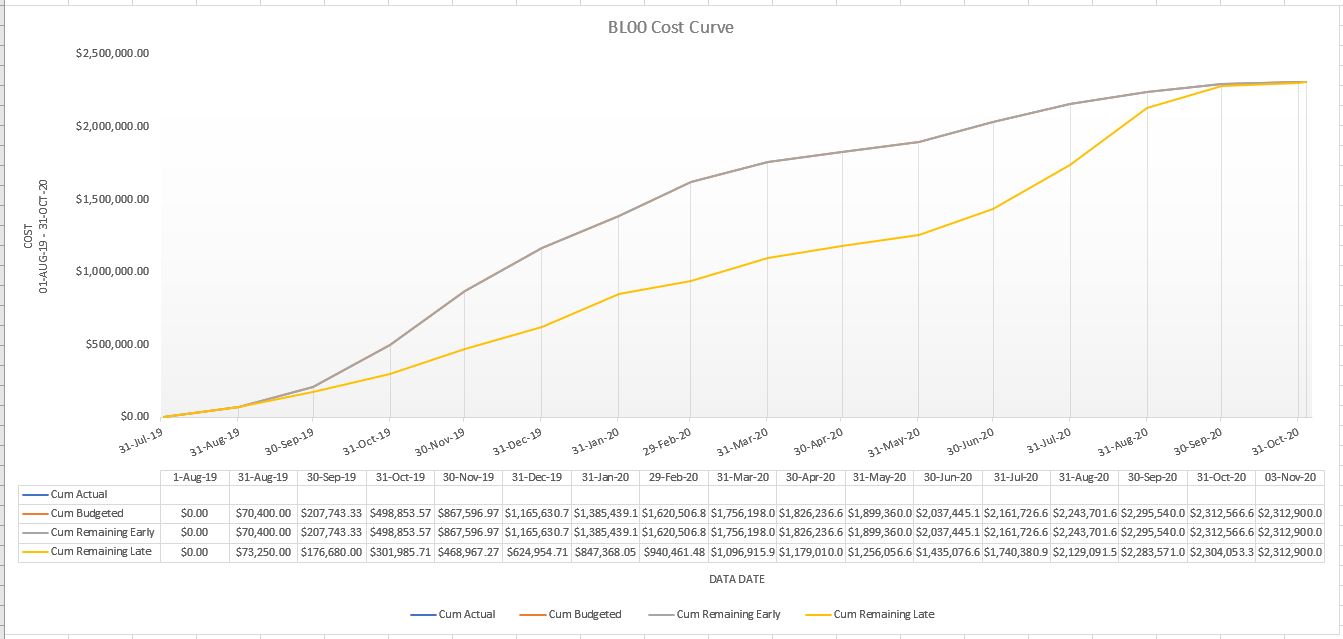
Figure 2 – Microsoft Excel Cost Curve for the Baseline Schedule
First, I complete the baseline schedule resource and cost assignments and set the baseline schedule as the project baseline. Then I go to the Tools dropdown and select Report Wizard.
Figure 3 – Primavera P6 Report Wizard
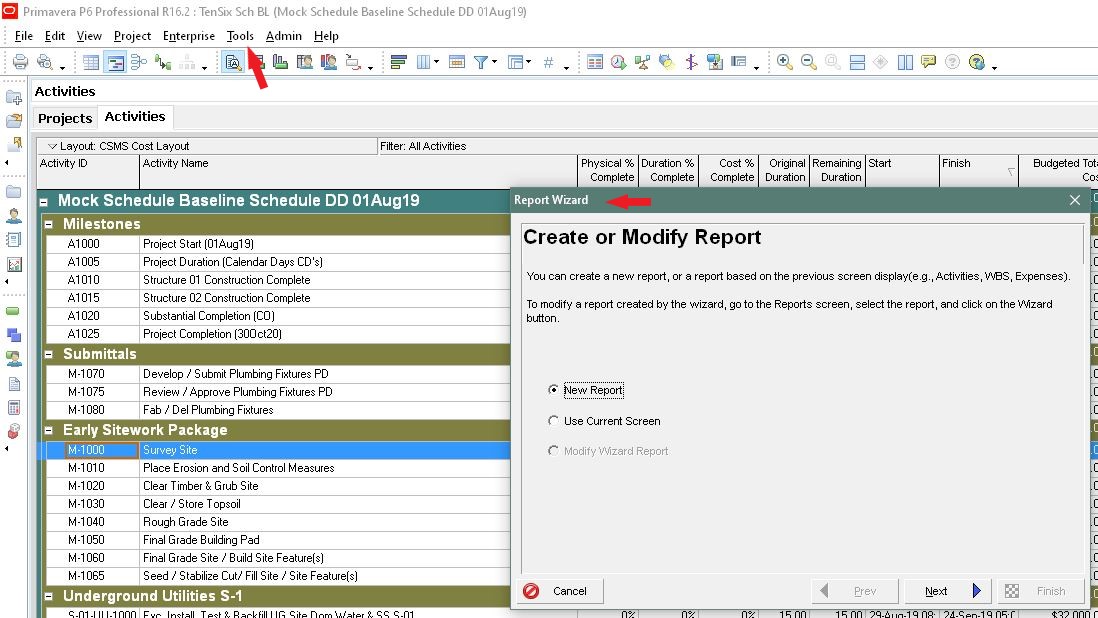
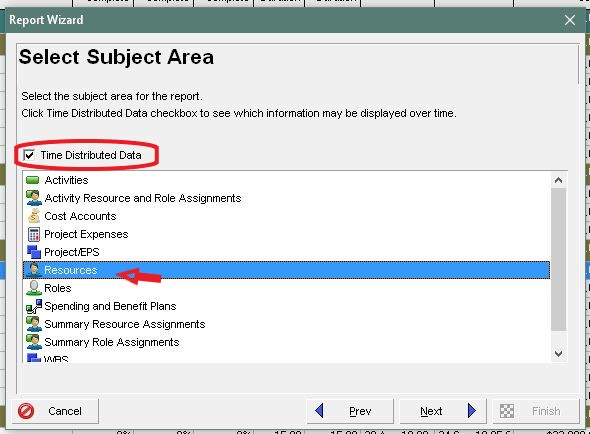
I select New Report and next. Then I select the Time Distributed Data box and select the Resources option.
Figure 4 – Selecting Time distributed Resources
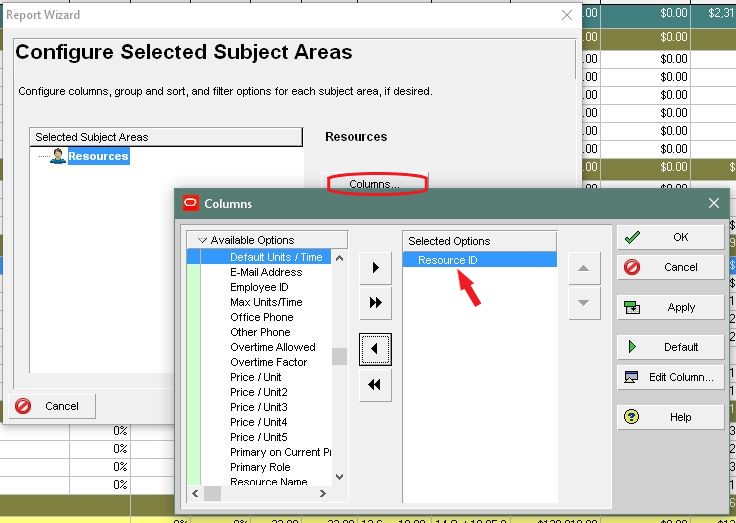
I first select the columns area and remove all the selected options except Resource ID and select OK.
Figure 5 – Columns Selection for Resource ID
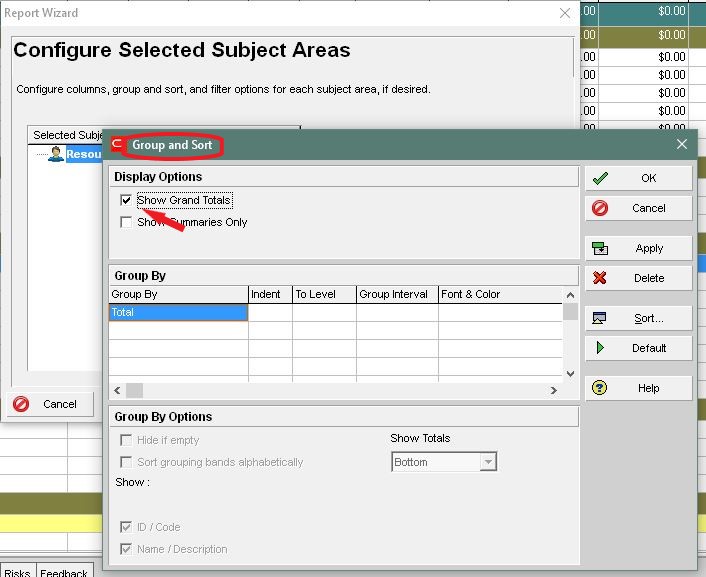
Then I select the Group & Sort area and select only the Show Grand Totals selection and then select OK.
Figure 6 – Group & Sort Show Grand Totals selection
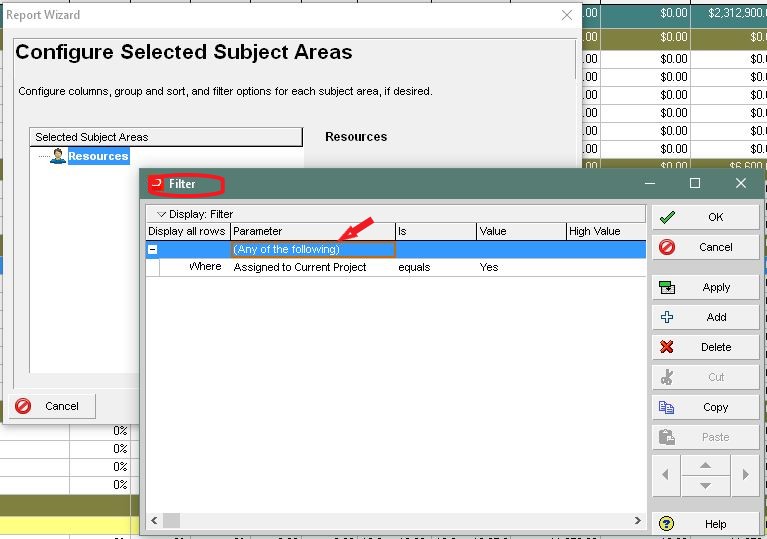
I go to the Filter area and create a filter using (Any of the following) Where Assigned to Current Project Equals Yes. I select OK and then Next.
Figure 7 – Filter for Current Project Resources
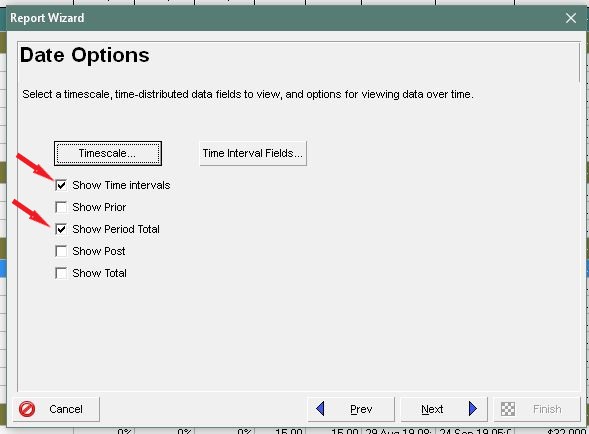
At the Date Options page I leave the Show Time Intervals and Show Period Total selections checked.
Figure 8 – Date Options Page
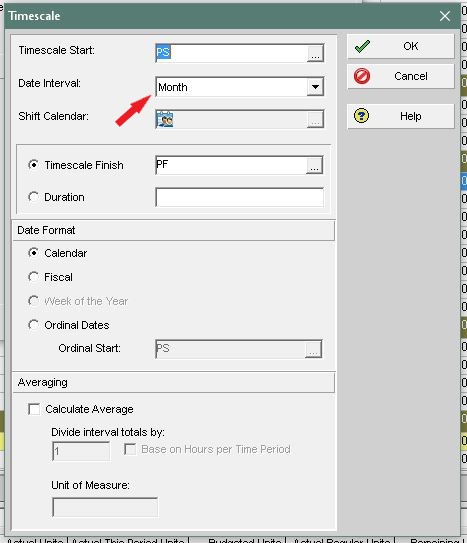
I select the Timescale area and then set the Date Interval to whatever reporting period durations I plan to use and select OK. (I usually select day and then make adjustments in the Excel data spread.
Figure 9 – Timescale Settings
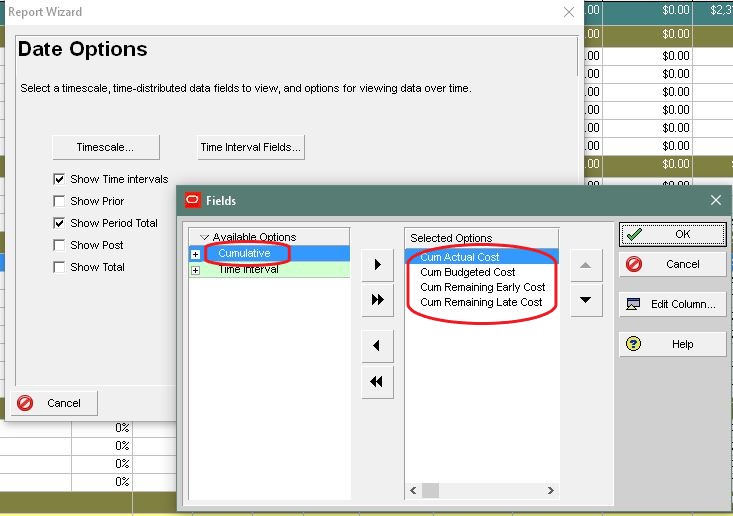
I then go to the Time Interval Fields area and select only the Cumulative Costs data sets. I then select OK to return to the Date Options page and lect Next.
Figure 10 – Time Interval Field Cost Data Selection
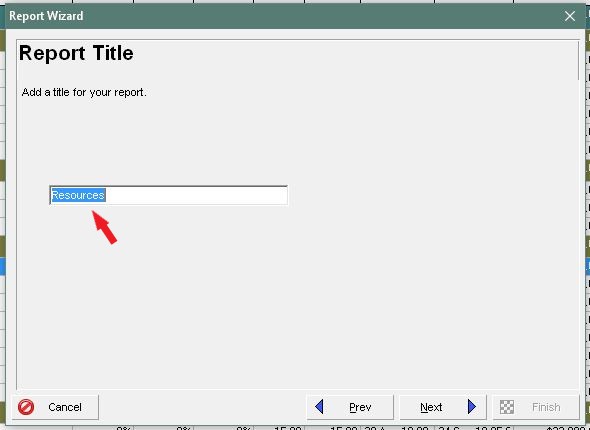
Personally, I don’t change the default name on the Report Title page. I just select Next.
Figure 11 – Report Title Page
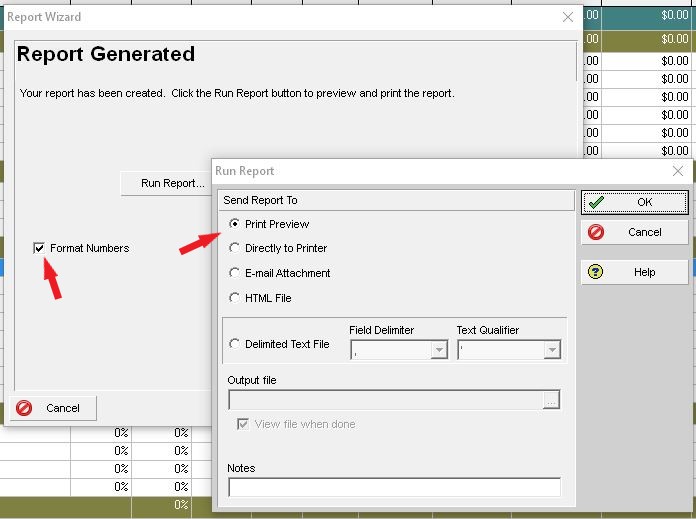
I leave the Format Number selection checked and select the Run Report area. I like to run the Print Preview under Send Report To and verify the contract cost values are correct.
Figure 12 – Run Report for Print Preview
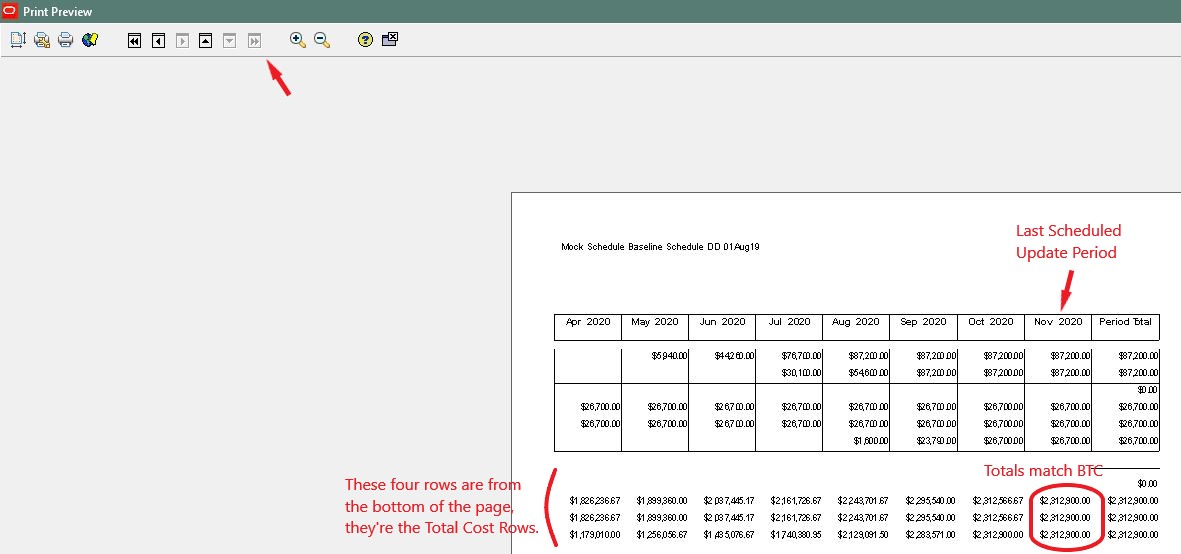
I do this by running the Print Preview and scrolling down and to the right until I find the end of the project for the Total rows at the bottom of the Resource ID rows. If the Cum Budgeted, Cum Remaining Early, and Cum Remaining Late values are correct I close out of this print preview. (If they are not, I have to go back and verify my cost assignments and try again).
Figure 13 – Checking the Contract Cost Values for the Report
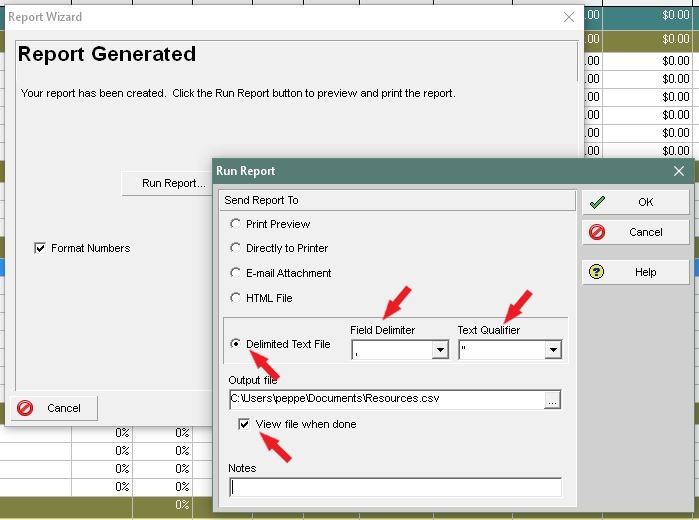
I then select Run Report again and then select Delimited Text File and set the Field Delimiter to comma and the Text Qualifier to double quotation. I set the Output file path and keep View file when done selection checked and then select OK.
Figure 14 – Run Report Settings
This gives me a csv file I can save as a Microsoft Excel file. I do this and format the columns. For the project total cost curve data, I can go to the bottom of the rows. I can copy the row with the dates at the top of the page and insert it just above the total cost rows for easy reference. I then select all the total cost data and create a line chart. I also name the rows as Actual Cost, Planned Cost, Early Cost and Late Cost or whatever I prefer for the project reporting.
Figure 15 – Total Cost Curve (I can also create cost curves for each resource)
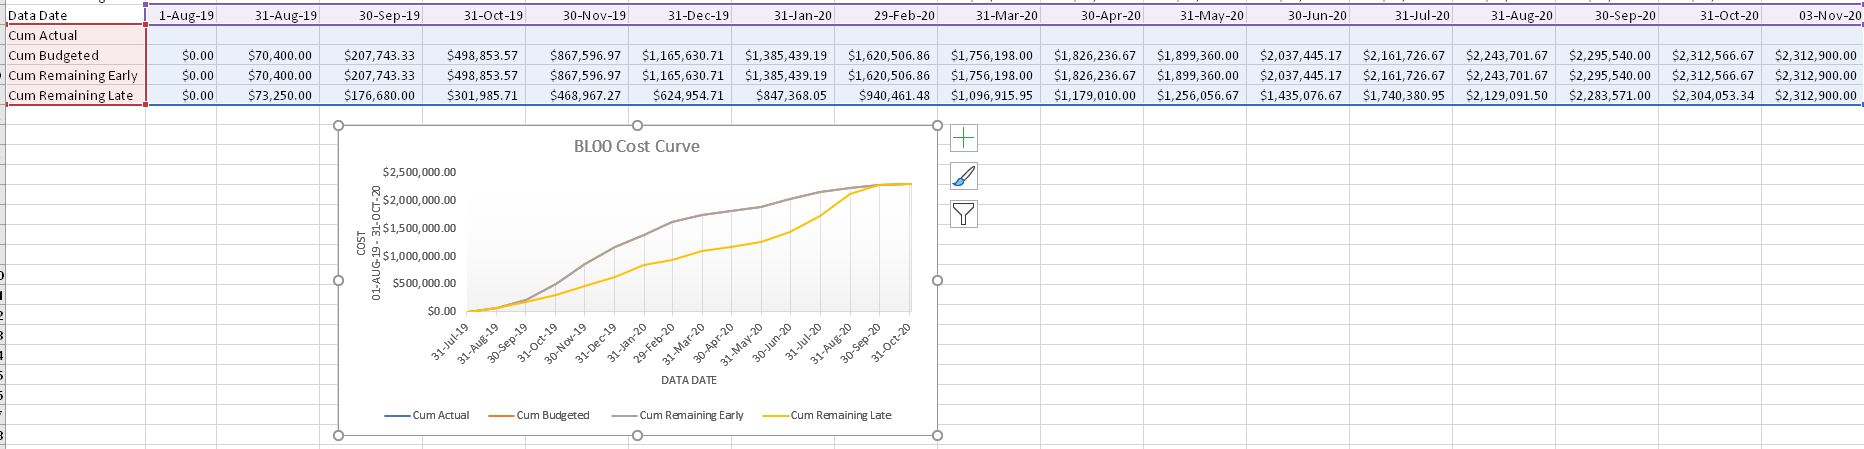
This gives me the time distributed base cost values for the project.
I will describe how I apply the actual costs per period in my next post.
Plan your schedule…

Paul Epperson CCM, PMP, PSP, PMI-SP
Paul has extensive experience as a Construction Manager. Over time, he became convinced that there is a critical shortage of skilled planning and scheduling professionals in our industry. In 2009, he backed away from his work as a Construction Manager and began focusing on planning and scheduling. He now serves our industry as a subject matter expert in this area.
You can visit Paul’s LinkedIn account to learn more about him and his website is http://www.conschmanservices.com