How do you format the Gantt Chart area to display, or not display, text on the Primavera P6 Gantt chart bars? Some of our customers have spent a good amount of time trying to figure this out and the answer is quite simple. So let’s take a look at how to do this.
This quick tip will show you how display text on the Primavera P6 Gantt chart bars.
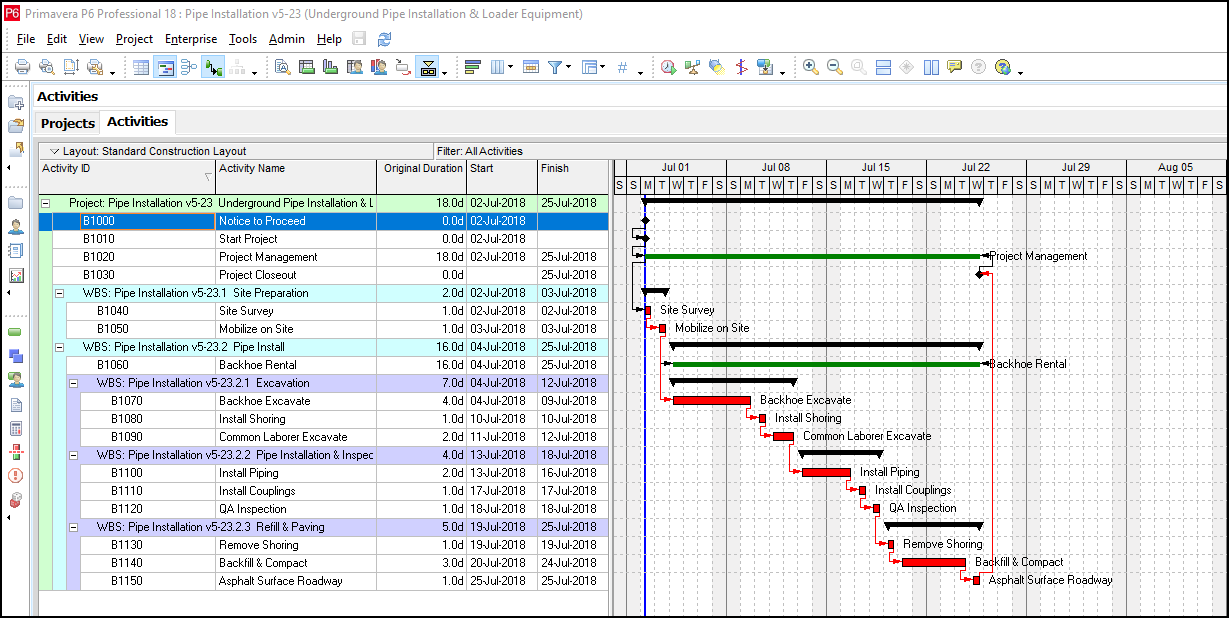
You can see below, in Figure 1, a schedule with unlabeled Gantt chart activities.
 Figure 1

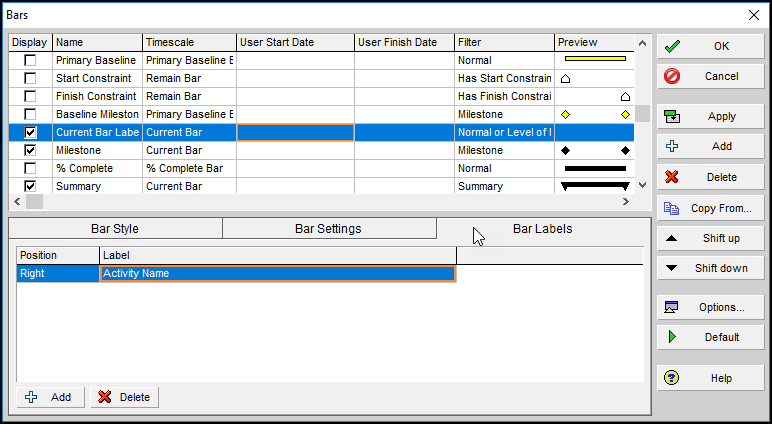
In the Bars dialog (Figure 2) we choose the Current Bar Label with Timescale Current Bar. The Current Bar Timescale captures activities that have actuals and/or remaining duration. The Filter is set to capture all Normal or Level of Effort activities. In the bottom frame we select the Bar Labels tab. We click the + Add button to add a new label. Using the drop down menus choose position Right and Activity Name.
Figure 2
Now your Normal and LOE activities should be labeled as in Figure 3.
Figure 3
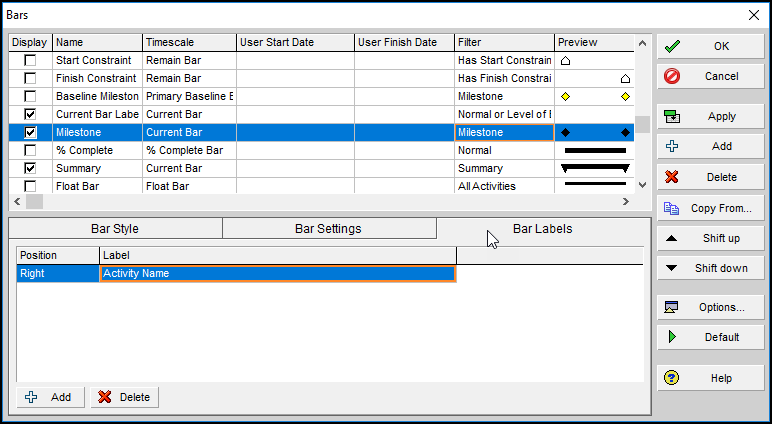
If we go back to the Bars dialog, we can highlight Milestones as well. In the bottom frame, simply select the Bar Labels tab. Add an Activity Name label (position right).
Figure 4
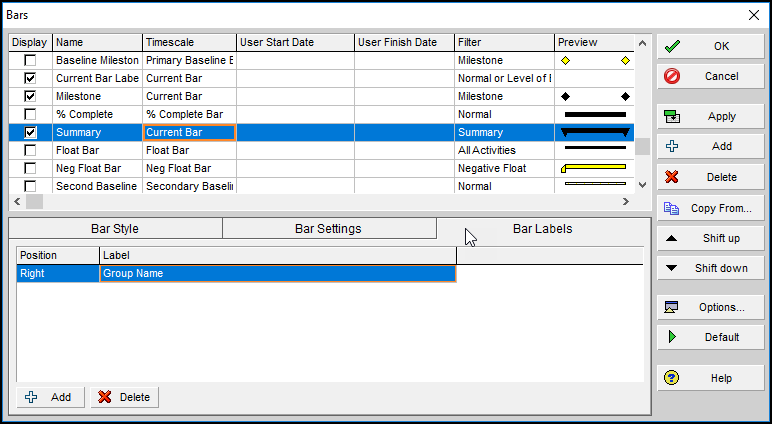
Moving on, we can also highlight the Summary bar. This time, as shown in Figure 5, we add a Group Name label (position right).
Figure 5
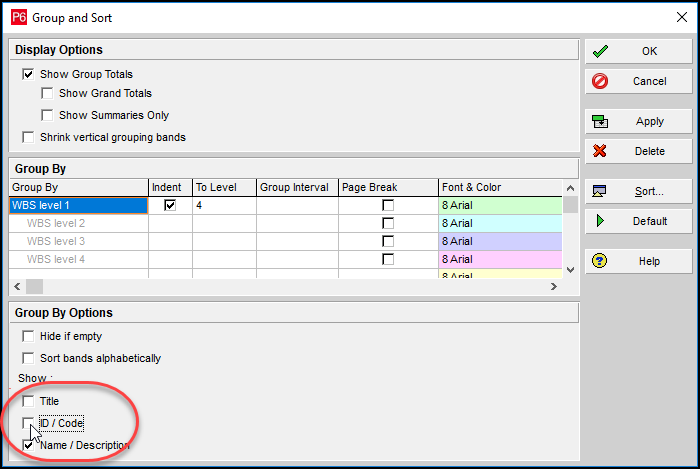
Before we display the Gantt chart go to the Group and Sort feature shown in Figure 6. Toggle off Title and ID/Code; we do not need to display either. Make sure Name/Description is toggled on.
Figure 6
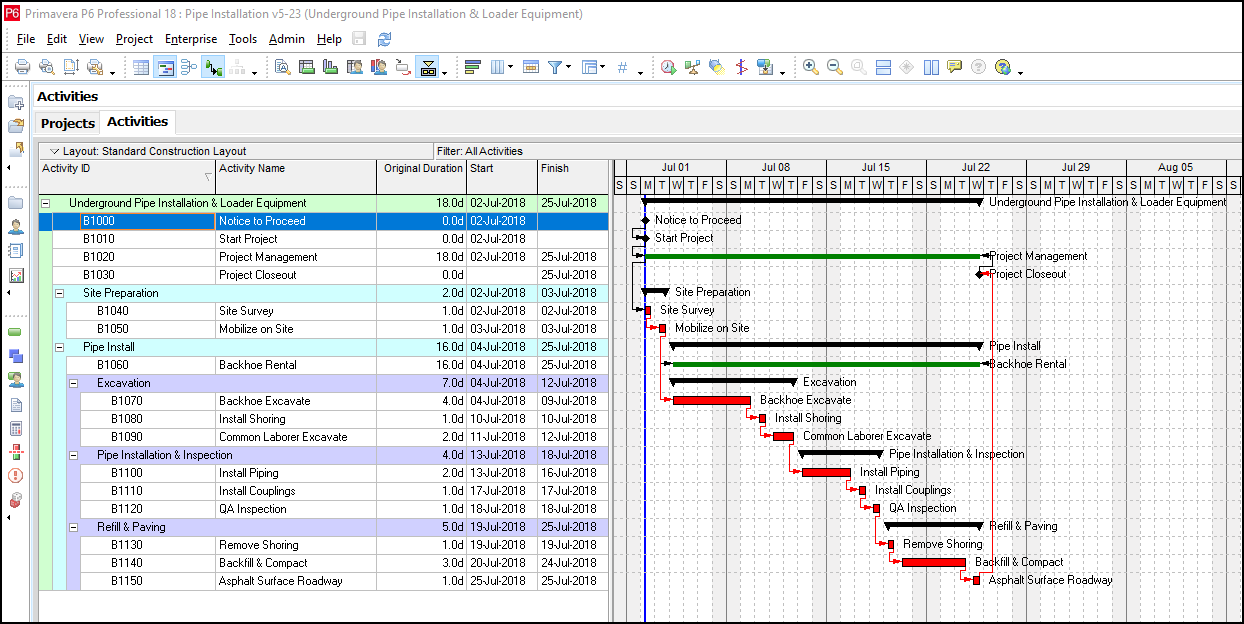
Your final Gantt chart with activity labels should appear similar to the below in Figure 7.
Figure 7
Summary
So there you have it. A rather straight forward way showing how to display text next to the bars on the gantt chart. Hopefully you find this helpful, offering insight into how the Gantt Chart bar formats can be manipulated.