To better understand how your Primavera P6 Professional project schedule is progressing over time, you may want to display several baselines on the Gantt chart. In a previous blog, we demonstrated how to display two baselines on the Gantt chart which you can read here Primavera P6 Displaying Two Baselines on the Gantt Chart.
In Primavera P6 Professional you can create and assign a project baseline and up to three user baselines for a total of four baselines. And it is also possible to simultaneously display all four baselines on the Gantt chart.
This article demonstrates a quick tip for displaying up to four baselines on the Gantt chart.
Generating baselines in Primavera P6 Professional is a three step process: take a snapshot of the project in time to create the baseline, assign the baseline, and finally define a bar definition of the baseline. In Figure 1 we have a schedule that has four baselines as desired.
 Figure 1
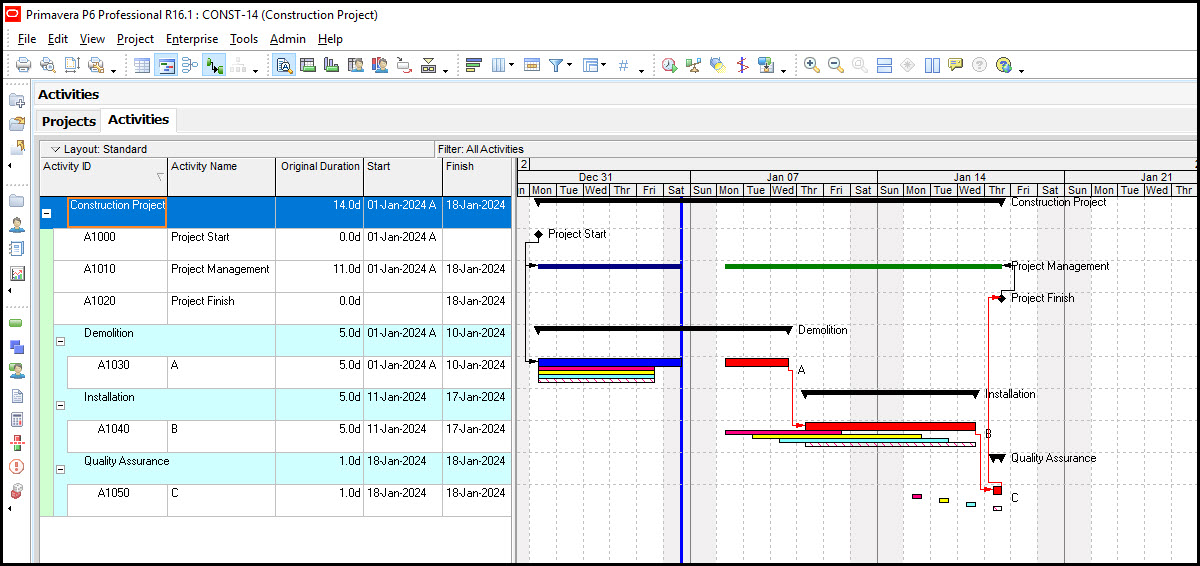
Figure 1 displays a baseline at project inception and three baselines showing three progress updates. Let’s review the steps for creating all four of these baselines.
We begin by creating the baselines using the maintain baselines feature. Select Project | Maintain Baselines…, Figure 2.
Figure 2
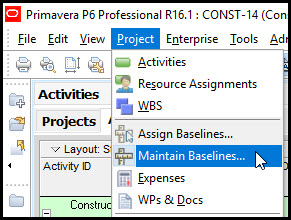
In Figure 3 we have four baselines that represent four snapshots of the schedule taken on different data dates (DD).
Figure 3
Note the DD of Construction Project – B4 baseline is 06-Jan-2024.
Next we assign the baselines. Select Project | Assign Baselines…, Figure 4.
Figure 4
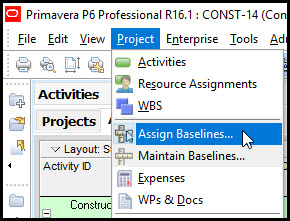
In Figure 5 we assign the first baseline at project commencement to the Project Baseline.
Figure 5
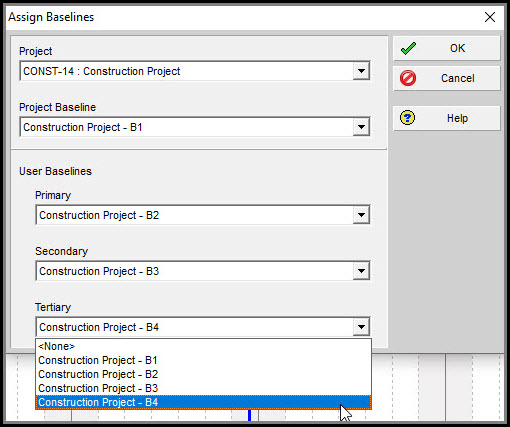
Each succeeding baseline snapshot is assigned to the Primary, Secondary, and Tertiary User Baselines, Figure 5.
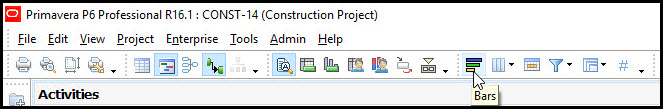
Now that we have created and assigned our baselines, we next focus on how each baseline will look on the Gantt chart. Select the Bars icon in the layout tool group, Figure 6.
Figure 6
In Figure 7 we have the Bars dialog that lists all four of our baseline Bars definitions at the bottom of the stack.
Figure 7
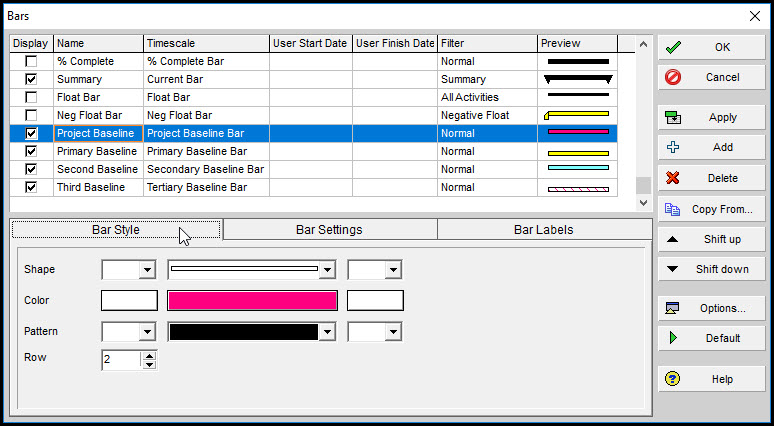
All four Bars definition have different Timescales, but the same normal filter. In the Bar Style tab we select the shape, color, pattern, and row. Selecting a suitable color and shape is intuitive. Choosing the correct row and shape requires more insight.
The Project Baseline has timescale ‘Project Baseline Bar’, Figure 8.
Figure 8
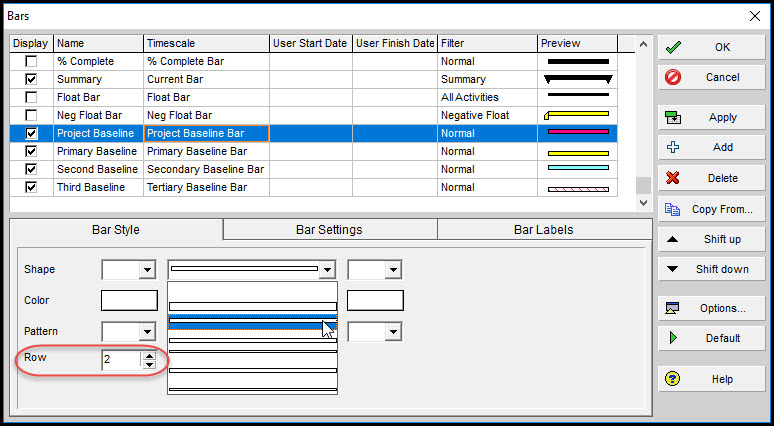
In the Bar Style tab we set the row the Project Baseline appears on and the shape. We set it to appear on row 2 and the shape is medium thick and high. The Primary Baseline has timescale ‘Primary Baseline’, Figure 9.
Figure 9
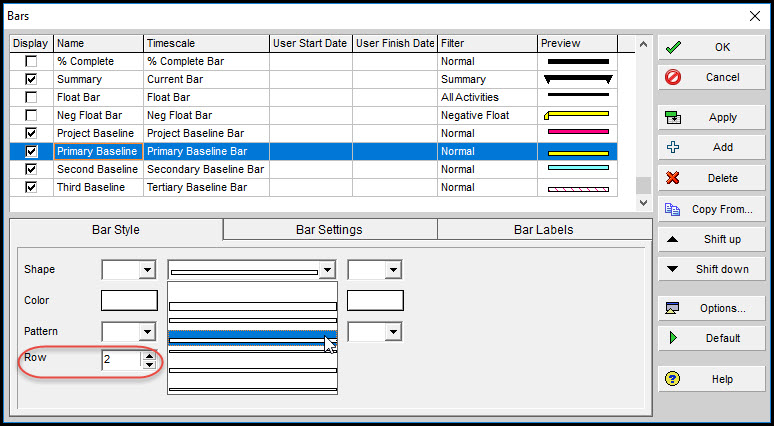
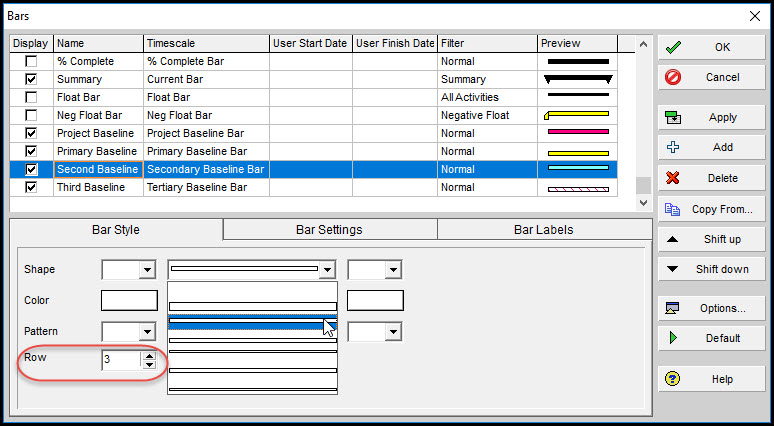
In the Bar Style tab we set it to appear, again, on row 2. This time, however, we chose a medium thickness shape and low. Again, choosing the correct shape is important; we select one of the shapes in the low position. The Second Baseline, Figure 10, is defined by the Secondary Baseline Bar timescale.
Figure 10
This time it appears on row 3. Its shape is medium thick and high. Finally, the Third Baseline, Figure 11, has the Tertiary Baseline Bar timescale.
Figure 11
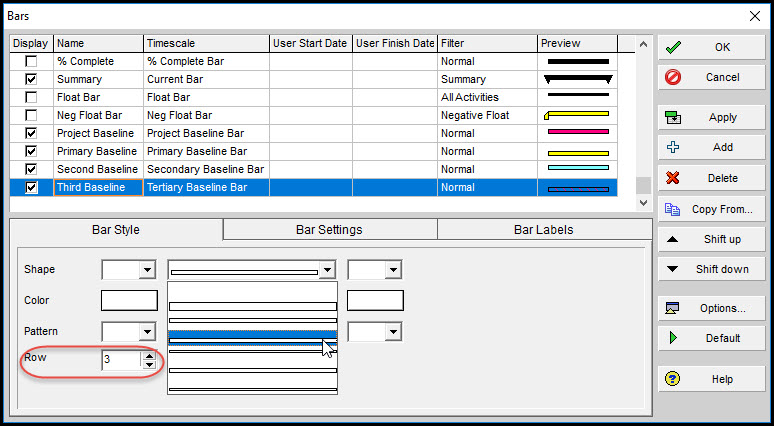
It too appears on row 3, and is medium thick and low. Great! We have defined the row and shape of each Bars definition.
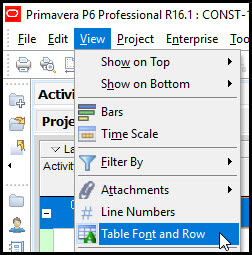
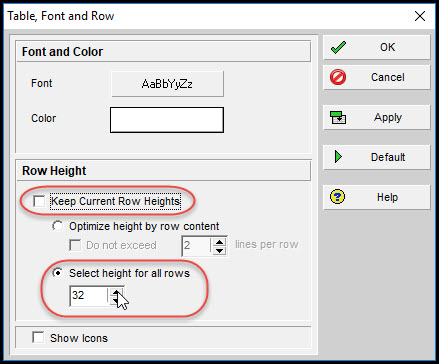
Make sure to toggle on to display each baseline, as shown in Figure 10. Having created, assigned, and defined our baseline bars we are almost done. We still have one more critical step before all four baselines appear on our Gantt chart. We need to set the appropriate height of the baseline bar rows. To do this select View | Table Font and Row, Figure 12.
Figure 12
In the Table, Font and Row dialog, Figure 13, toggle off ‘keep current row heights’, then set the height for all rows to 32.
Figure 13
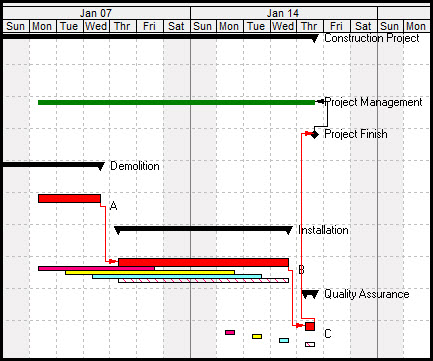
Click OK. And the Gantt chart and four baseline bars appears as displayed in Figure 14.
Figure 14
Summary
It is possible to display a total of four baselines on the Gantt chart in Primavera P6. This includes a project baseline, since project inception, and primary, secondary, and tertiary baselines, to measure schedule period progress. The key to displaying four baselines is to select the appropriate row and bar shape.
The shape includes the bar position, either high or low. Primavera P6 Professional also does not automatically adjust row height, so adjust the row height, accordingly, to display all four baselines on the Gantt chart.