Are you concerned that interim deliverable delays may postpone your project completion date? There is an efficient way to monitor interim deliverables and their potential impact on project completion using Primavera P6.
A project manager’s major duties includes on time completion of the project. On time completion is a proficient manager’s goal. On schedule completion of interim deliverables is also preferred. But interim deliverable delays may or may not be cause for concern, as they may or may not lead to project delays.
It is possible to compare current projected interim deliverable delivery dates to project float when the finish date of the project is constrained. After a few schedule updates the scheduler can find the trend of the project float for interim deliverables. Extending this float trend tells whether the current pace or effort towards delivery of interim deliverables will lead to delays on the project critical path.
This article demonstrates monitoring project float of interim deliverables in Primavera P6 Professional.
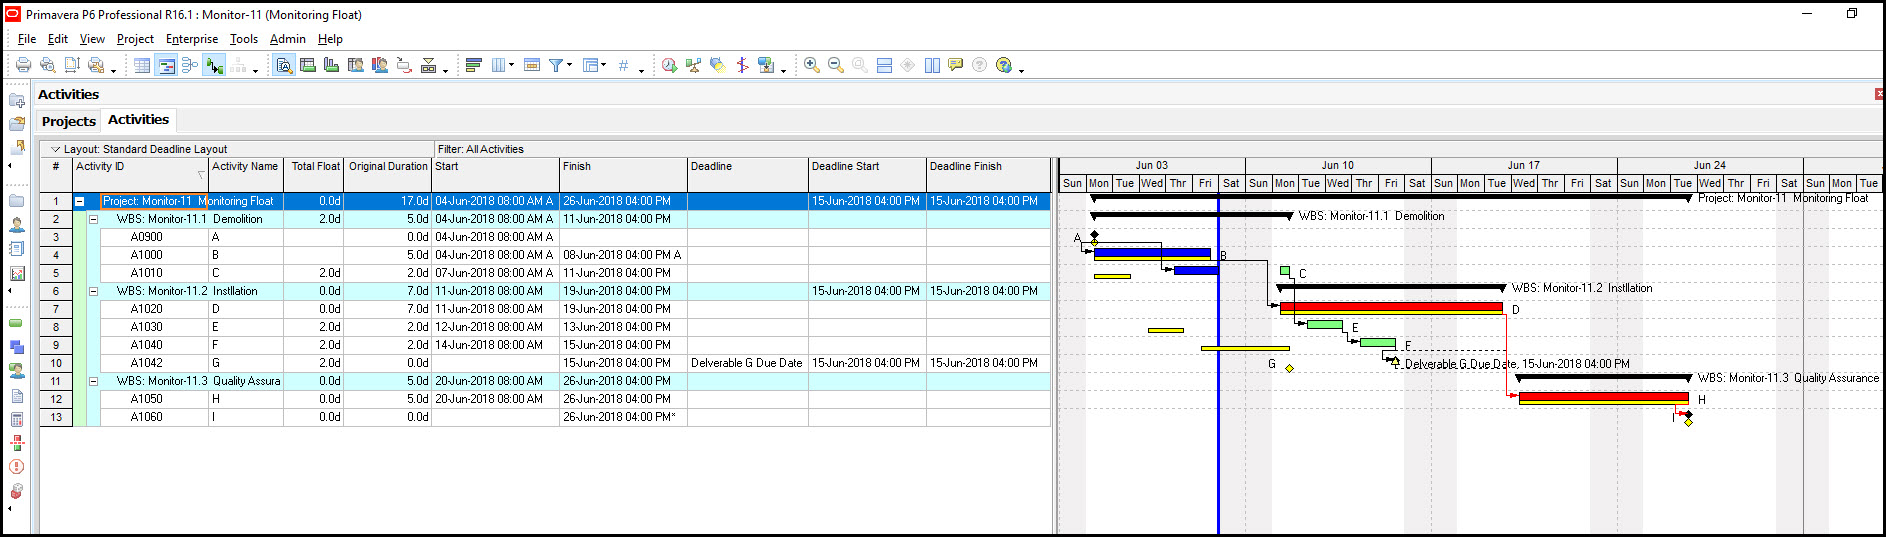
We have in Figure 1 our demonstration Primavera P6 Professional schedule.
 Figure 1
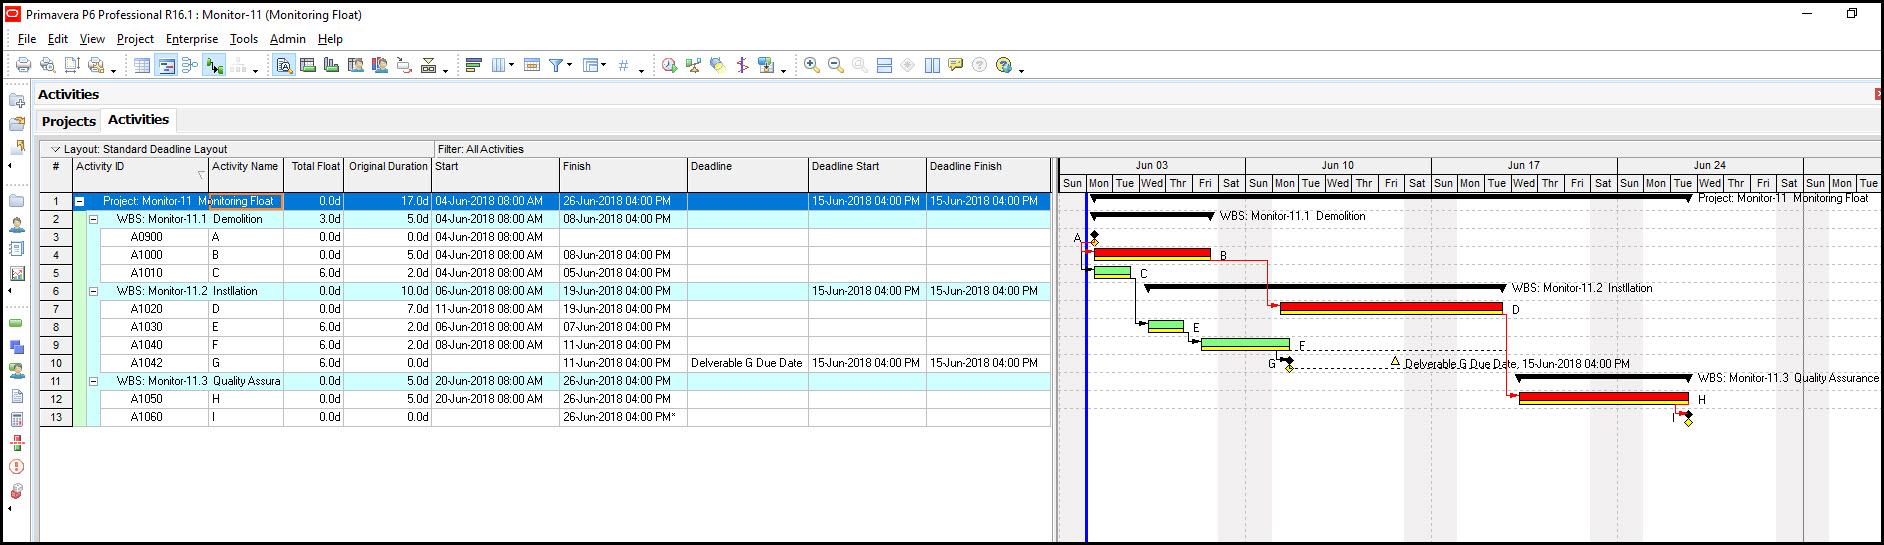
This schedule has two paths: a critical path – activities B, D, and H and a non-critical path – activities C, E, F, and G for deliverable G. Note the deliverable G due date, 15-June-2018. Refer to the following blog Primavera P6 and User Defined Date Bars for guidance on inserting passive delivery date markers on the Gantt chart:
We progress this schedule to the end of day one, Figure 2.
Figure 2

After one day of progress we find that the critical path continues according to plan, but the non-critical path C,E,F, and G delays. The total float of activity G at day one update is 5-days. We plot the project total float of activity/deliverable G on an excel spreadsheet, Figure 3.
Figure 3
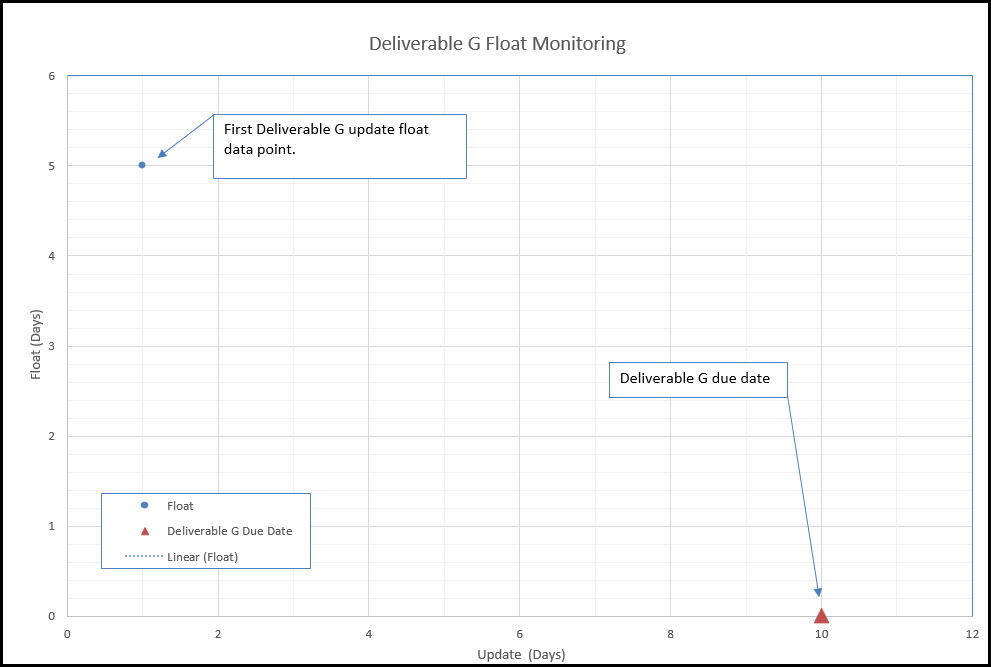
Activity G is due for delivery on day ten. We currently have no trend analysis.
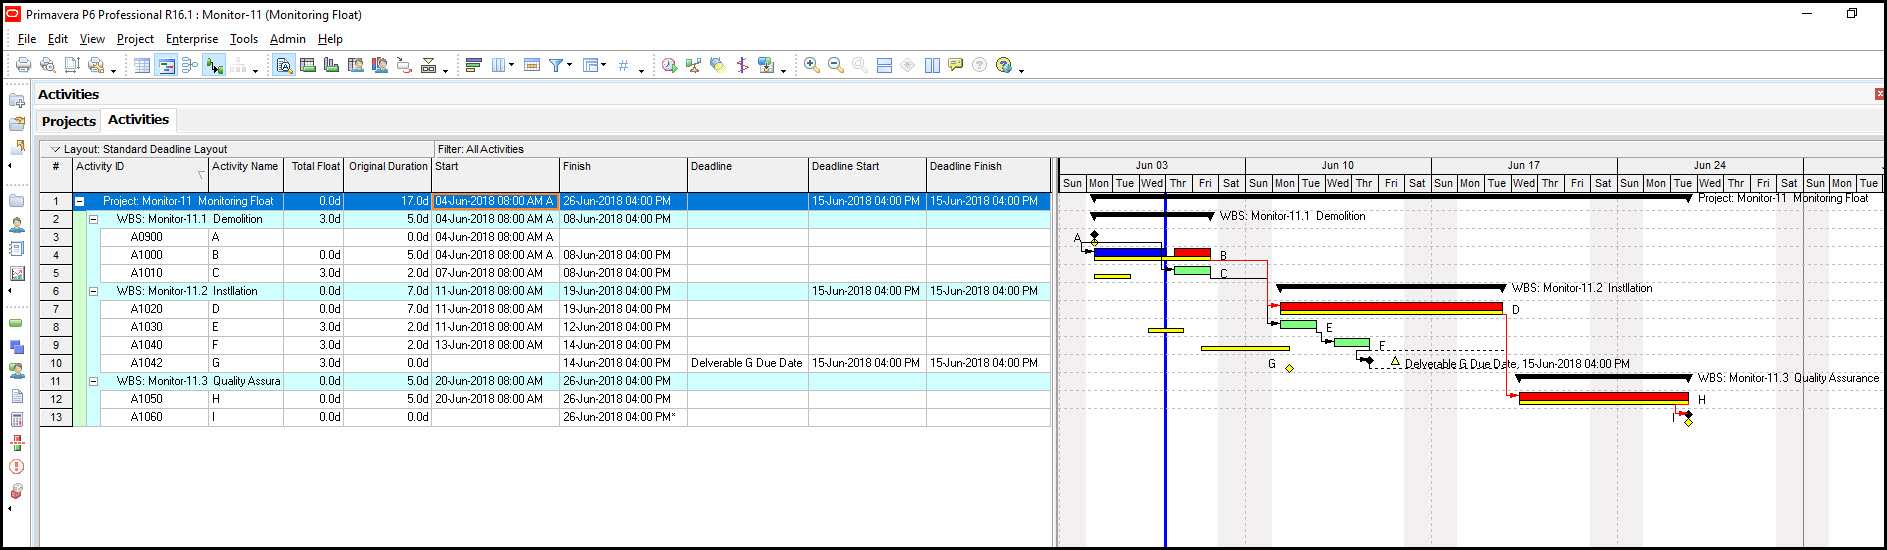
The schedule progresses another 2-days in Figure 4.
Figure 4
After our second update, the total float of activity G reduces to 3-days. At this point our interim deliverable G is still on schedule and the project still continues according to plan, which is good news. And when we plot the float of deliverable G after the second update we get the graph in Figure 5.
Figure 5
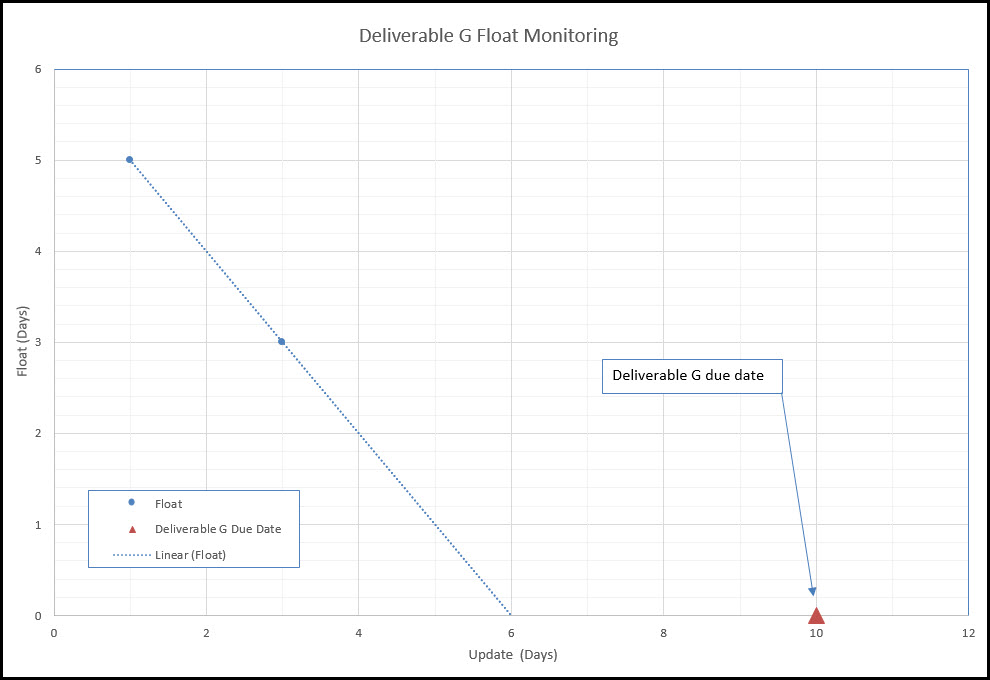
At this point we have a trend for the project float of C, E, F, and G. But we really want to wait for one more update before interpreting this trend data.
We update the schedule to the end of the first work week in Figure 6.
Figure 6
Deliverable G is now planning to finish on schedule, which is still good news. However, when we plot the third project total float value of deliverable G, Figure 7, our trend analysis is not good.
Figure 7
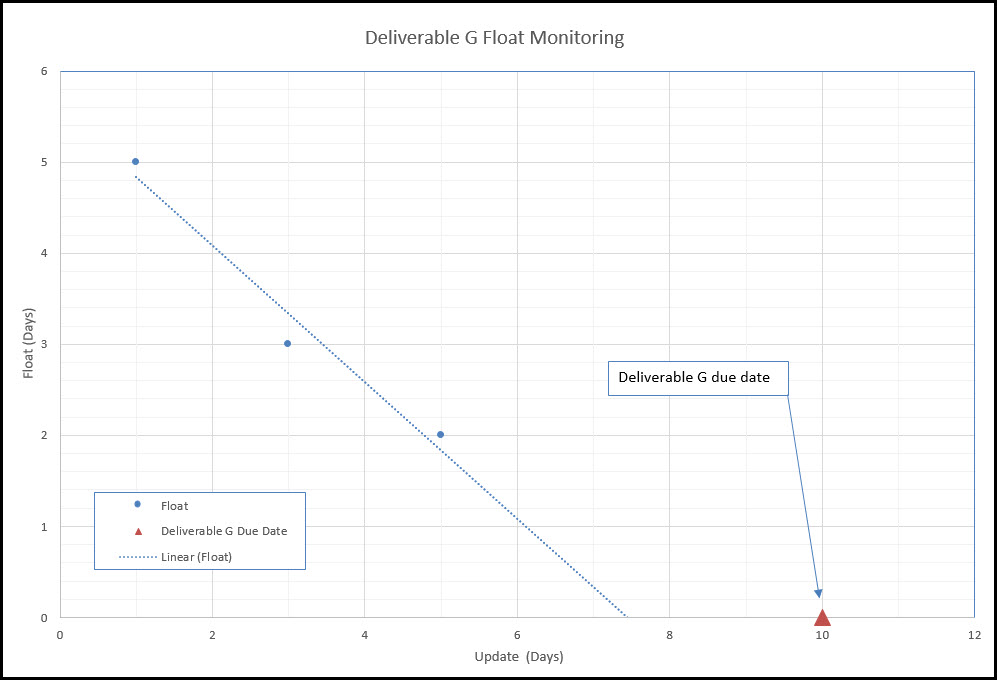
It says that path C, E, F, and G becomes critical in day seven. And at the current rate of effort path C, E, F, and G will become critical before deliverable G’s delivery date in day ten. Not good. Worse this trend comes after three updates, which provides us enough data to confidently extrapolate the trend data. So at this juncture, if path C, E, F, and G continues at its current rate of effort, our project will delay before delivery of deliverable G.
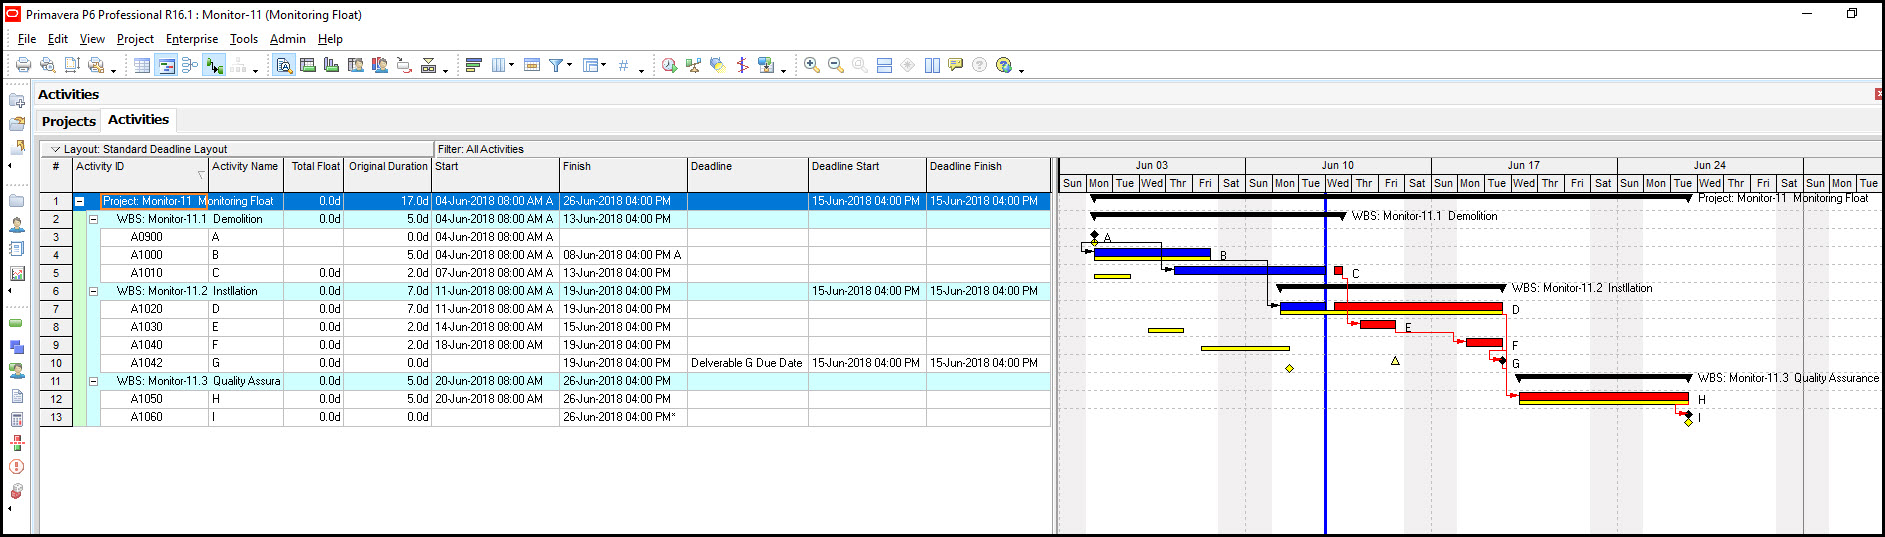
After one final update, Figure 8, we find that path C, E, F, and G has indeed become critical.
Figure 8
We also missed deliverable G’s delivery date, which also is a problem. So in day seven, assuming our current rate of effort, total float of path C, E, F, and G goes to zero. When we plot this final update, Figure 9, we indeed find that the previous project total float trend of path C, E, F, and G held. And path C, E, F, and G becomes critical on day seven as predicted.
Figure 9

Summary
After three updates, tracking of deliverable project float provides a reliable trend. This trend may then be extrapolated to find whether interim deliverable delays are jeopardizing the project completion date. Thus plotting deliverable project total float provides valuable insight on project completion.
And the project float trend of multiple deliverables may be graphed in a high level dashboard. This dashboard can be inspected for early warning detection of deliverable and project completion progress issues.