Microsoft Project displays a critical bar for activities that have zero or less total slack. You may, however, want to specifically highlight activities that have less than zero total slack. These are referred to as super critical activities.
The critical path is the shortest path through the schedule. And activities along the critical path cannot delay without delaying the project completion date. All is well as long as the schedule proceeds as planned. Sometimes, however, there are activity constraints that cause tasks to have negative total slack. This indicates that the project is behind schedule.
In these scenarios the scheduler must look to optimize the schedule and eliminate negative total slack. If this is your projects situation it is helpful to have the Gantt chart distinguish between activities that cannot delay from tasks that are already behind. This is possible when a super critical Gantt chart bar is defined.
This article demonstrates how to create Gantt chart bar to highlight activities that are already behind or super critical.
We begin with our demonstration project, Figure 1.
 Figure 1

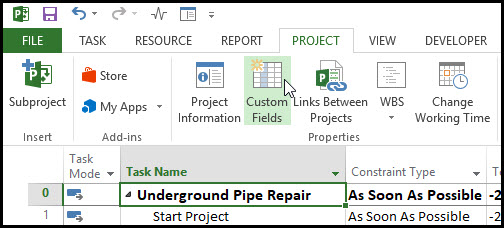
This is a project to repair an underground pipe. Let’s make a custom field for our super critical tasks. Select the project tab | properties ribbon group and custom fields, Figure 2.
Figure 2
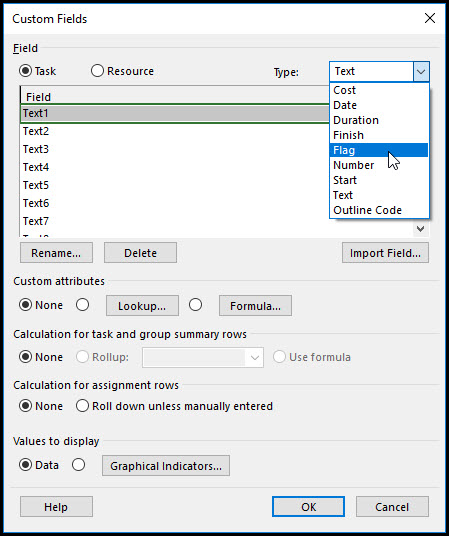
In the custom fields dialog, Figure 3, select Flag from the type drop down menu.
Figure 3
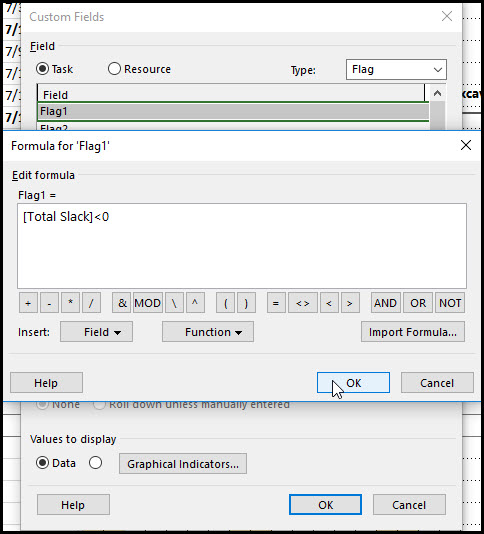
Then in custom attributes toggle formula. Enter the formula depicted in Figure 4.
Figure 4
Great, our super critical flag is ready.
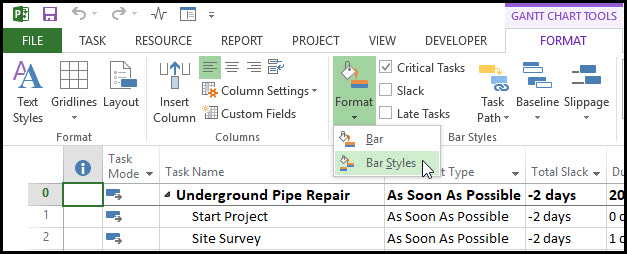
Continue by creating a super critical bar styles definition. Select format | bar styles ribbon group | Format and Bar Styles, Figure 5.
Figure 5
Enter the super critical bar styles definition depicted in Figure 6.
Figure 6
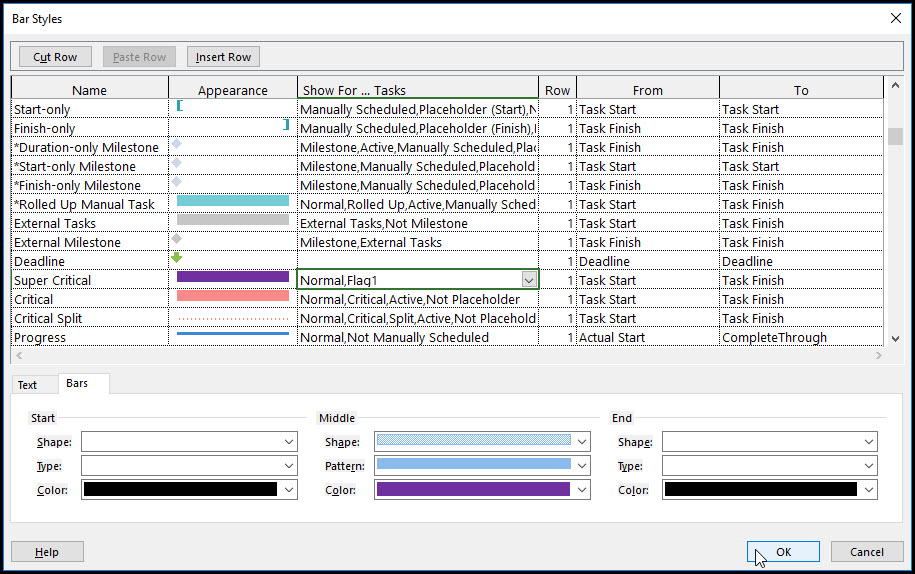
Note the super critical bar color and filters Normal and Flag1. Select OK, and the Gantt chart appears as per Figure 7.
Figure 7
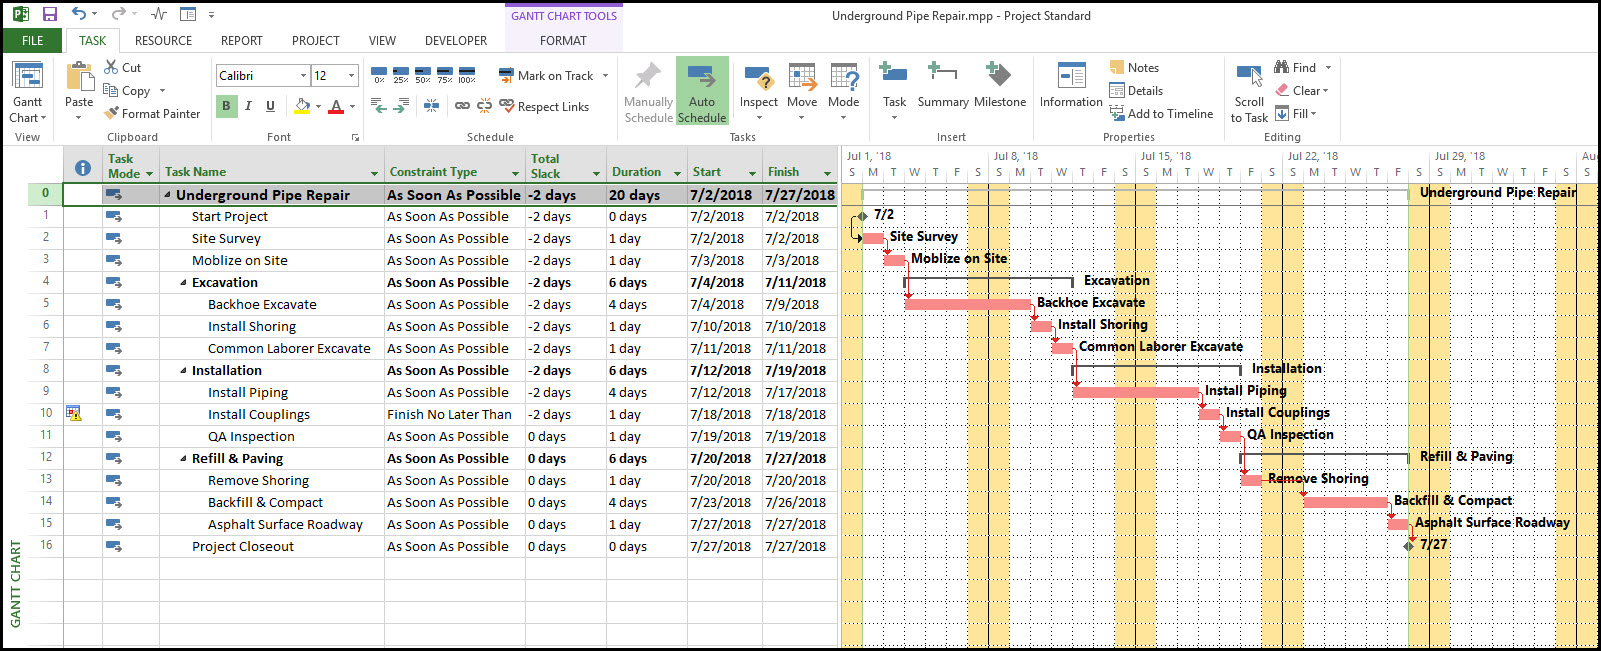
So our super critical bars do not appear on the Gantt chart. What went wrong?
The problem is Microsoft Project overlays bar styles definitions lower in the stack overtop definitions higher in the stack. As per Figure 6, our bar styles super critical bar is above the critical bar, so it does not appear on the Gantt chart; the super critical bar is a subset of the critical bar. We need to relocate our super critical bar styles definition below the critical bar definition, as per Figure 8.
Figure 8
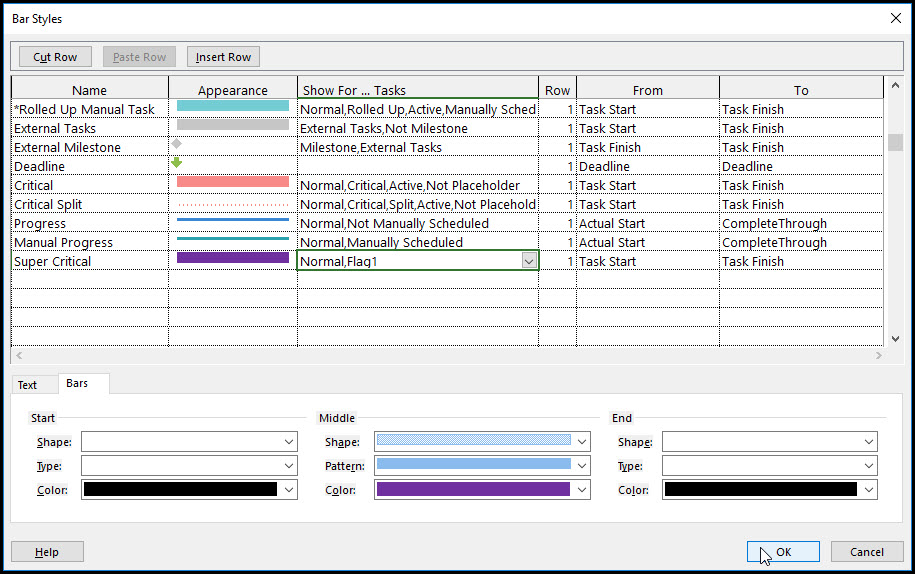
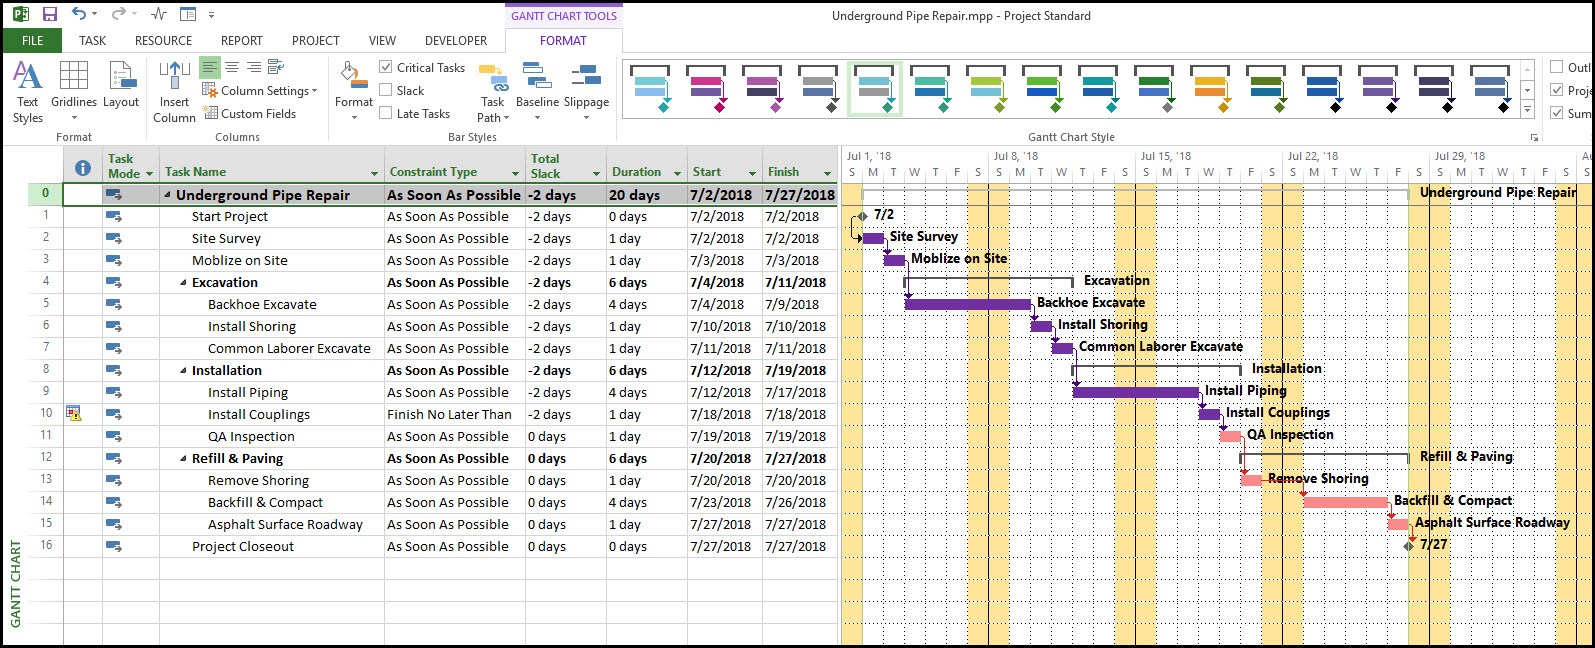
Select OK, and the super critical bars, purple bars, now appear on the Gantt chart, along with the standard critical bars, red bars, Figure 9.
Figure 9
Summary
Critical activities are important to monitor, as they determine the duration of your project. It is also good to identify tasks that cannot delay from tasks that are already behind schedule. Microsoft Project’s super critical activities Gantt chart bar supports this effort. Stakeholders can be alerted of tasks behind schedule directly on the Gantt chart, which is at the heart and center of good scheduling analysis.