A Brief Introduction to EVM
Earned Value Management is the key to unlocking the door to a plethora of project status metrics is earned value, which is a way of placing a value on the progress of work achieved. But how is earned value specified?
Much in Earned Value Management (EVM) hinges on the monetized value you place on accomplished work or progress on deliverables.
This article is a brief introduction to EVM to support more insightful performance measurement.
Earned Value Management
Earned Value Management is a way of quantifying project progress and comparing actual progress to planned progress and actual money spent. EVM strategically shifts the viewpoint from planned vs. actual (traditional tracking used in non-EVM organizations) to planned vs earned vs actual.
Planned Value
Most projects come with budgets. Therefore shifting the perspective of the deliverables planned, to planned value is not a particularly hard leap to make. The planned value is the agreed upon budget or cost of the project and how it will be spent over time.
A fundamental concept in Earned Value Management is that work is worth the planned value (budget) of the work. Planned value simply stated is how much value you have planned to earn in a given time. For example, you planned to spend $6000 to install a diesel generator in a boat. Planned value is therefore $6000. By definition, when that work is 100% complete, it will be worth $6000 to the project.
Earned Value
Earned value measures deliverable progress in monetary terms (value of work done), and this allows the project manager to quantify progress as a monetary value. Why is this helpful? Once you can place a monetary value on progress achieved, you can compare it with the planned value and actual cost. This change in perspective from percent completed to value of work done or earned value is a shift in thinking that contributes significantly to the EVM analysis.
So earned value is a way of placing a monetary value on the progress of work achieved. The earned value metric is fundamentally a dollarized percent complete value. Instead of saying a deliverable completed by a specified date, earned value says a value in terms of a dollar amount of the project completed by a specified date. Earned value stated simply is how much value you have actually earned on the project in a given time.
Again, it is a shift in thinking to measure deliverable progress in monetary terms (value of work done). But this allows us to plot and compare all three metrics (planned value, earned value, and actual cost) on a single graph, which, again, opens the door to analysis otherwise not possible. So by measuring deliverable progress in monetary terms (value of work done) it is possible to project or overlay work progress on the same plot as budgeted cost and actual cost, which significantly increases the possibility of available metrics.
Cost Graph
Let’s first decipher our schedule situation from a cost graph and then add earned value to show how the addition of earned value provides a better understanding of the true schedule situation. In Figure 1 we have a budgeted verses actual cost plot over time or spend plan verses funds spent.
 Figure 1
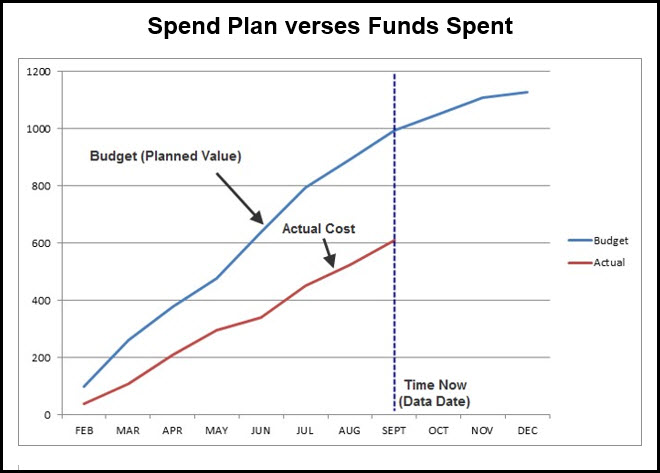
The budgeted cost is the planned value of project work. Again, think in terms of value or economic terms. This plot shows that project actual costs are significantly lower than budgeted costs. It appears that all is well with our project – we appear to be underspending. But what does this plot tell us about the actual work completed? Not much; the percent of budget spent or actual cost does not equate to percent of project complete. “Percentage spent is not percentage done”. So we are still in the dark in regards to our status situation.
Cost and Earned Value Graph
Now let’s add earned value to this plot to gain more insight; earned value accounts for both the project cost and achieved work situation to place a value on work achieved. This project cost and deliverable progress measurement in terms of dollars provides that valuable third leg, Figure 2, to the budgeted and actual cost plots.
Figure 2
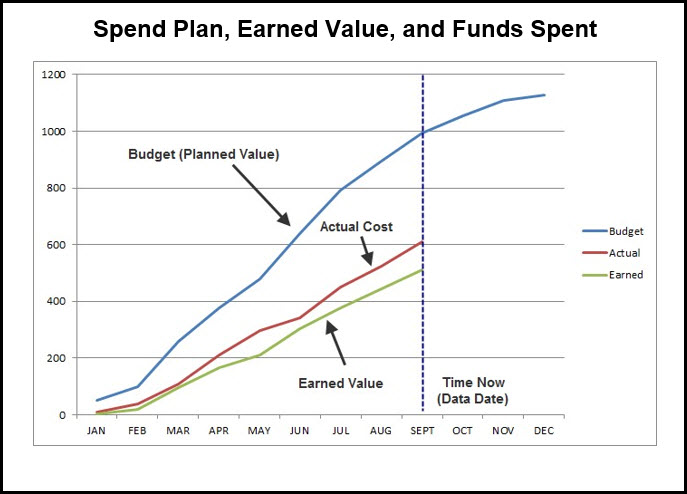
When we add a dollarized percent complete or earned value to our plot we observe that our actual schedule situation is not good. The earned value as of September is significantly less that the budgeted cost so we are behind schedule. And the earned value as of September is less than the actual cost, so our project fund burn rate is greater than the deliverable progression rate; we are over budget on completed work. The earned value plot has unveiled our true project situation, which is not good.
Our graph exercise shows the value in plotting the earned value metric and costs together. It provides much better schedule insight, and allows analysis otherwise not possible. The intent here is not to list the many earned value measurement metrics that become available from this three legged graph.
For now we want to better appreciate earned value by discussing a project.
In our demonstration project, you have let a contract to build 4 miles of railroad track for $400,000 in four months to a contractor. At the end of 3 months the contractor completed only 2 miles of track at a cost of $350,000.
If your graph only considers budgeted and actual costs then it will say that at the end of three months you are $50,000 over budget. You spent $350,000 when you were budgeted to spend only $300,000. But this analysis only considers planned costs and actual costs; the value of work achieved is not considered. Earned value considers cost and scope of achieved work together
Earned value analysis says that each month they should “earn” $100,000 if they are on target for cost and schedule. Unfortunately, in 3 months they only completed 2 miles of rail so their earned value is only $200,000. Well, they spent $350,000, so they are over budget by $150,000, and not $50,000. They also only completed 2 miles of rail when scheduled to complete 3 miles, so they are behind schedule by $100,000. This schedule analysis is reflected in the earned value graph for the rail project, Figure 3.
Figure 3

Inspecting this graph shows an actual to earned value cost variance of $150,000, which is 3 times the cost variance when only considering cost values, and not earned value. The planned to earned value dollarized schedule variance is $100,000. Note that the plot also conveniently displays the time value of this schedule variance, 1 month.
Summary
This brief introduction to EVM should help improve how performance measurement can be improved. When it comes to measuring schedule progress it is common to consider completed scope or submitted deliverables. If, however, we include both cost and scope of work achieved together in the progress measurement we arrive at the useful scheduling term earned value.
The earned value metric, again, is fundamentally a dollarized percent complete. So earned value is not simply money spent; it is the dollar value placed on completed scope. Consider it like money earned for scope completed. The subcontractor completes work and is monetarily compensated accordingly. This compensation correlates to the earned value at a moment in time during the life of the project.
The project is thus compartmentalized into chunks of work that have monetary value, and, if complete, earned value. The earned value in addition to the spending plan (budget) and funds spent provides much insight into the true project situation.