 Understanding Schedule Critical Drag
Critical activities are all the schedule tasks that cannot delay without postponing the completion date of the project. Therefore, these activities are rightly called critical; you definitely want to pay attention to momentum on these activities. But of all your critical activities, which ones generate the most drag on your schedule progress?
When one considers drag, most likely, one thinks of a longitudinal force exerted by air, fluid, or other medium. , on an object. For example, drag is a measure of an object’s resistance to movement in a fluid; drag slows down an object in fluid.
Critical drag in scheduling is a measure of the amount of time by which a critical path activity is slowing down a project. Fluid drag measurement helps a naval architect focus on redesign of those parts of the submarine that have the greatest resistance to movement in water.
In a like manner, a scheduler would focus on shortening those activities that have the greatest impact or “drag” on schedule progress. So those parts of the schedule that have the most drag are inspected for possible rescheduling and optimization, and, similarly, those part of the submarine that have the greatest drag are redesigned.
This article is an introduction to using schedule critical drag as a measure of an activities impedance or resistance to project progress.
Critical drag measurement in scheduling, supports the creation of an efficient schedule. And the most efficient schedule optimization efforts come from shortening those activities that have the most critical drag. The problem is determining which critical path activities are solely costing the schedule the most time. The critical drag measurement provides this insight.
Similar to how a naval architect would redesign a protruding surface resisting movement in a fluid, the scheduler looks to reschedule those activities that appear to protrude out from among parallel activities and resist schedule progress.
Activity duration is not always the harbinger of critical drag. A 20-day duration activity may have a critical drag of 1-day and a 10-day duration activity may have a critical drag of 10-days. Again, consider how an activity protrudes out from among parallel activities causing drag.
Let’s examine the rules for computing drag in a simple schedule. In a simple network consisting of finish-to-start (FS) relationships drag is determined as follows:
- If a critical activity has no parallel activities, its drag equals its duration.
- If a critical activity has parallel activities, its drag is the lesser of the two: the total float of the parallel activity that has the least total float or its own duration.
Our demonstration schedule is displayed in Figure 1.
 Figure 1
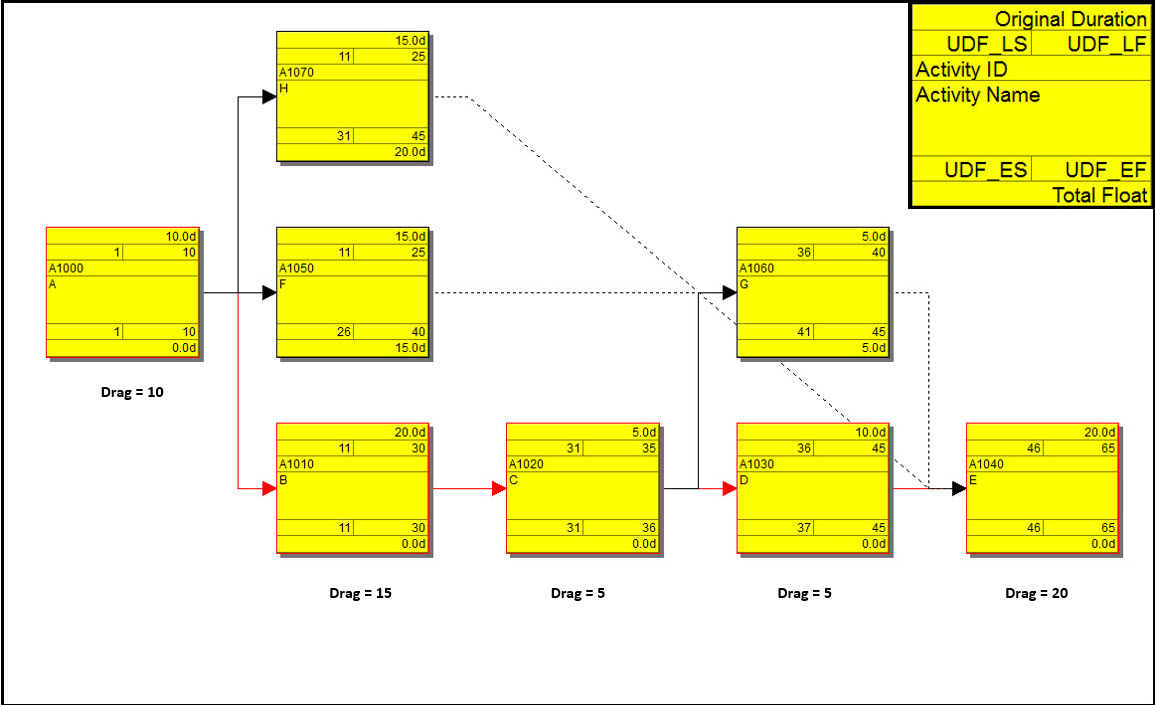
The critical activities in this schedule are A, B, C, D, and E. Non-critical activities F, G, and H have total float values of 15, 5, and 20, respectively. Activities along the critical path have critical drag values, as displayed in Figure 1. Note the network diagram legend on the top right. The critical drag values were determined as follows:
- Activities A and E have no parallel activities so their drag values are equivalent to their original duration values 10 and 20 days.
- Activities B and C are parallel to F and H, which have total float values of 15 and 20. The drag of B is equivalent to the least total float parallel activity F, which has a total float of 15. The original duration of B is 20, so the drag of B is therefore 15. The drag of activity C is 5 days, the lesser of the parallel activity total float and the original duration of C.
- Activity D’s 10-day original duration is greater than G’s 5-day total float. The drag of activity D is therefore 5.
So the drag of activities A, B, C, D, and E is 10, 15, 5, 5, and 20. Your effort to reduce critical drag, and, therefore, optimize the schedule should focus on firstly Activity E and secondly on Activity B. These two activities, E and B, have the greatest critical drag on the schedule progress.
Summary
The most efficient way to shorten a schedule is to focus on optimizing the critical activity that is solely costing the schedule the most time. This is the activity with the most critical drag. And this activity protrudes out of the schedule and resists progress similar to how a body surface may protrude and cause resistance to movement in a fluid. This process is counter intuitive to most prominent scheduling tools that typically measure and highlight activity positive total float or buffer.
Note that the rules for determining critical drag differ when schedules include start to start (SS) and finish to finish (FF) relationships. Our demonstration was composed solely of FS relationships.
Another closely related term to understand is drag cost, which attempts to quantify the cost of a critical activity’s schedule delay. Critical activity delay may reduce a project’s expected monetary value or increase project overhead costs. Drag cost assigns the cost of project time to the individual critical path activities that are directly adding time to the schedule.