The P6 progress line is an efficient way to monitor schedule progress in Primavera P6 Enterprise Project Portfolio Management (EPPM). The progress line helps schedulers quickly spot the status of their activities directly on the Gantt chart.
The Gantt chart is at the heart and center of scheduling software. The Gantt chart is a powerful pictorial representation of the schedule situation. The progress line is a Gantt chart feature that provides a visual representation of activity progress. The progress line provides a high level and simple view of schedule progress.
This article describes usage of the progress line in Primavera P6 EPPM release 16.1.
Our demonstration project schedule is displayed in Figure 1.
 Figure 1
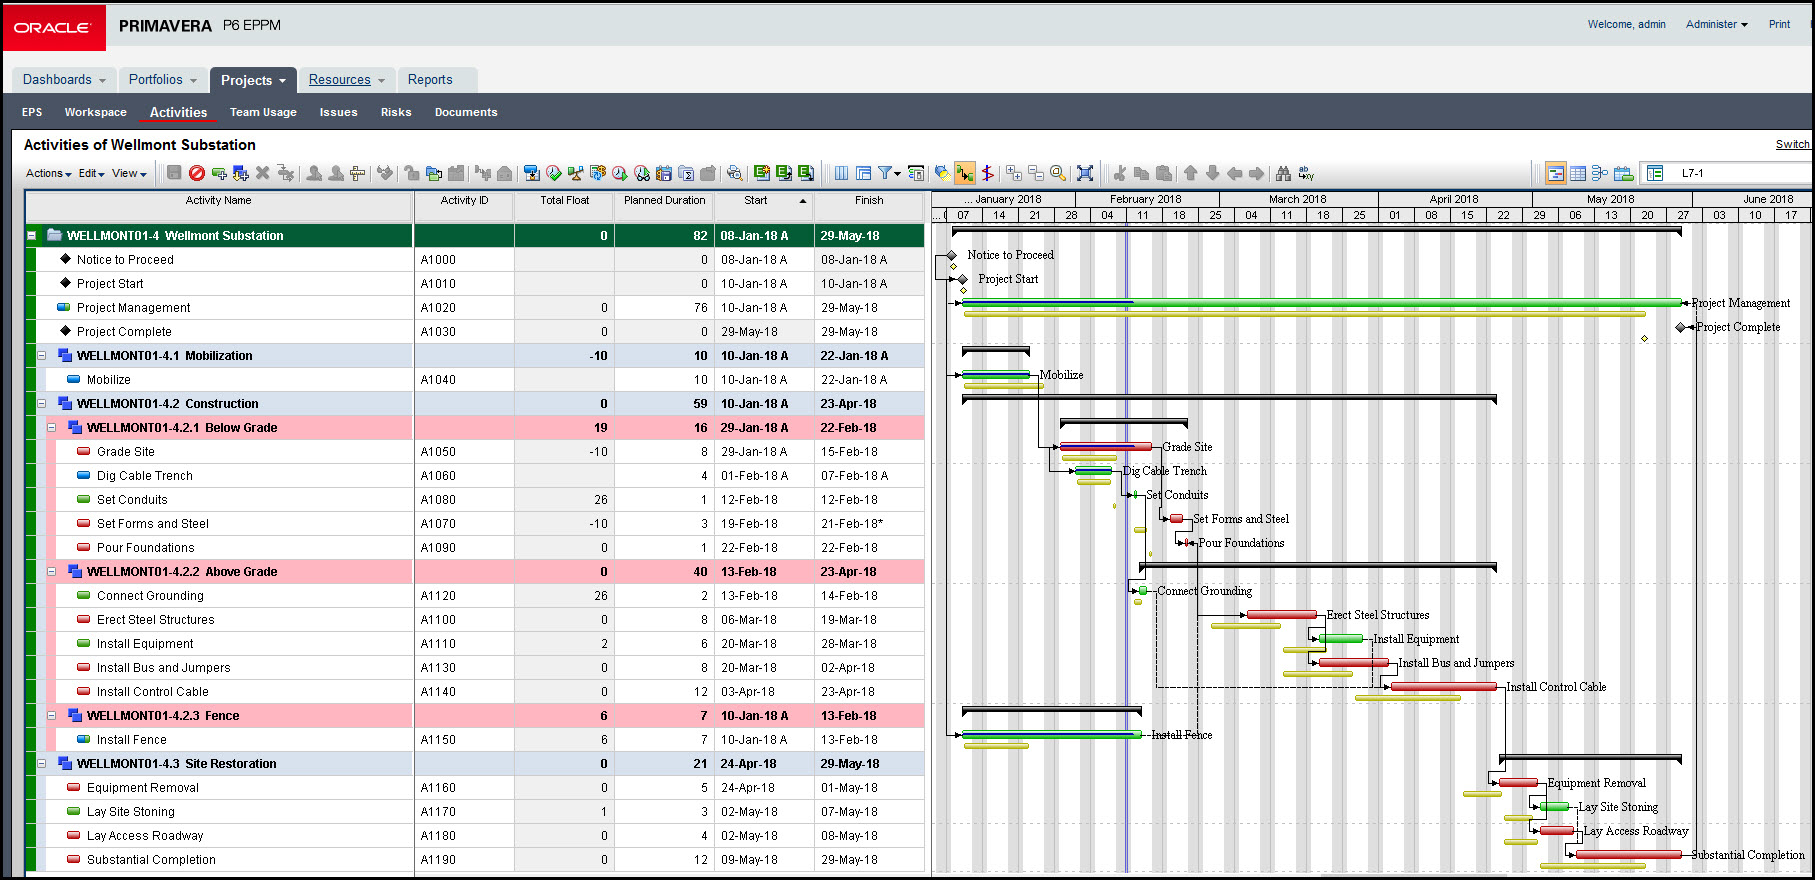
It is possible to gage the progress of activities in this schedule by comparing the current activity status in relation to the baseline (yellow bar). This procedure requires shifting back and forth along the timescale to compare the baseline and current bar tasks. This process becomes tedious, particularly for large and/or long duration projects.
The progress line, however, over lays on top of the Gantt chart at the data date, and provides a quick on time, behind, or ahead status for each activity in the schedule.
The progress line in Primavera P6 EPPM is set in the customize Gantt chart options dialog, Figure 2.
Figure 2
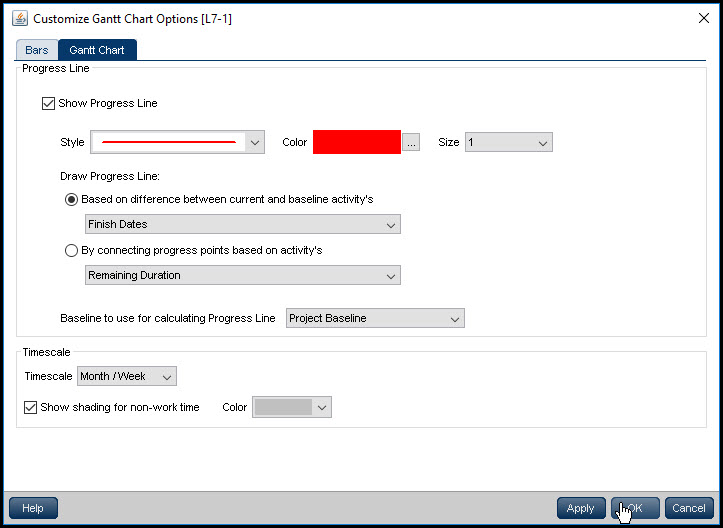
Toggle show progress line. Set an appropriate progress line style, color, and size. Toggle draw progress line “based on difference between current and baseline activity’s finish dates”. We chose finish dates because it is more conservative measure of schedule progress. It is easy to start activities; completing activities is the real challenge.
In the baseline to use for calculating progress line select the project baseline. Make certain you have a baseline assigned to the project baseline in the define baseline feature. Click OK and your schedule with progress line appears similar to Figure 3.
Figure 3
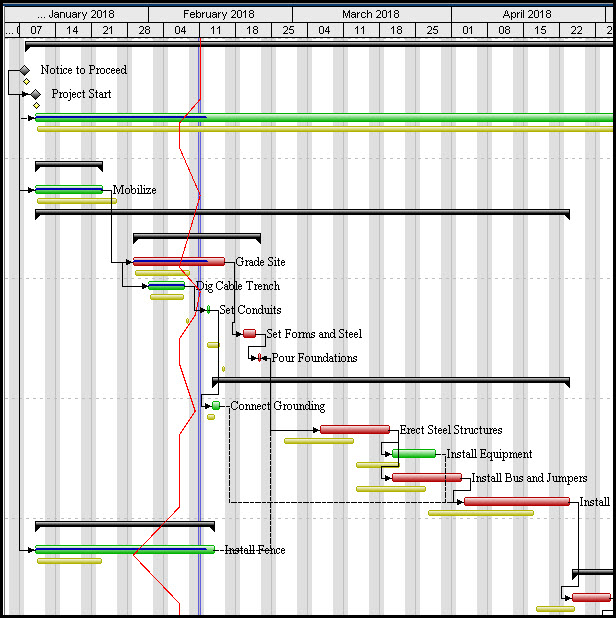
Note the progress line overlaid on top of the data date, Figure 3. All progress line data points to the right of the data date indicate activities finishing ahead of schedule. All data points to the left of the data date warn that activities are behind schedule. Data points falling on the data date are completed or on schedule.
In our demonstration schedule Mobilize is complete and the progress line falls on the data date. Dig Cable Trench is also complete and the progress line at this activity falls on the data date. After Dig Cable Trench the schedule falls behind for all remaining activities as indicated by the progress line shifting left of the data date. Note, in particular, that the install fence activity is significantly behind schedule.
Summary
Primavera P6 EPPM’s progress line provides a quick graphical perspective of schedule status at the data date. This is particularly helpful for efficient assessment of activity progress on long duration projects. The progress line displays the on schedule, behind schedule, or ahead of schedule activity status.
Activities that are behind schedule, as per the progress line, are flagged for further review. In this way the project manager reviewing schedule progress can quickly focus in on those activities causing delays.