Deltek Acumen Fuse Schedule Diagnostics
Deltek’s Acumen Fuse software package offers a wide range of project analysis and diagnostic tools to help you raise the quality and effectiveness of your schedule data.
In this article we will take a look at the Acumen Fuse schedule diagnostics tool and walk through the process of analyzing a schedule from the Primavera P6 system. The analysis featured in this article is a general analysis based upon practice standards of scheduling in the industry. Other analysis such as the DCMA 14 Point Assessment is also available in Acumen Fuse schedule diagnostics by changing the selection at the bottom of the window.
Acumen Fuse Projects Tab
The first step in this process is to open the project that you wish to analyze in the Projects tab of the Acumen Fuse interface. As you can see in the following screen shot there are a number of systems that you can bring project data in from. These include Microsoft Project, Primavera P6, Excel spreadsheets, Open Plan, Cobra, Phoenix Project Manager, a standard UN/CEFACT xml file and Safran.
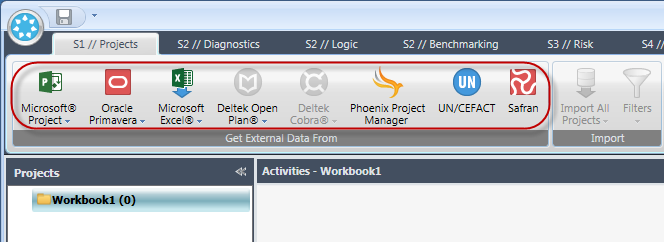
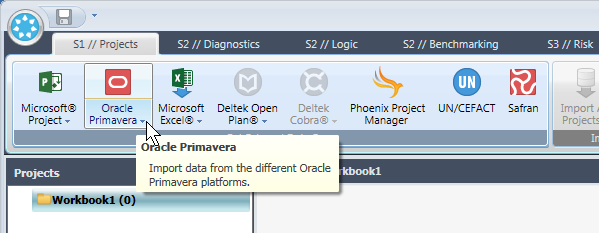
When you first open Acumen Fuse the Projects list contains an empty Workbook. The first step is to load a project into the empty workbook. To do this, we click on the desired external data system: in this case Oracle Primavera P6.
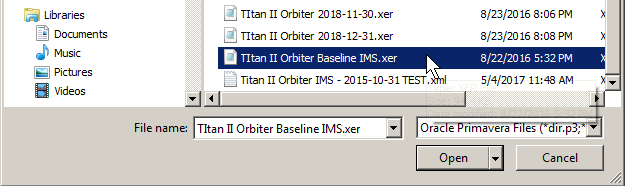
In the ‘Add Primavera P6 File’ dialog, select your .XER or .XML file that contains your Primavera P6 schedule:
Tip: if you click on the lower part of the product button, Acumen will provide you with a comprehensive list of all the formats and loading possibilities for the particular product you are importing.
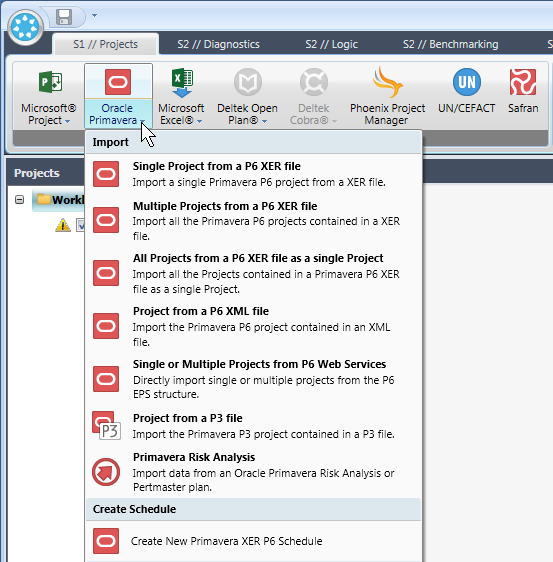
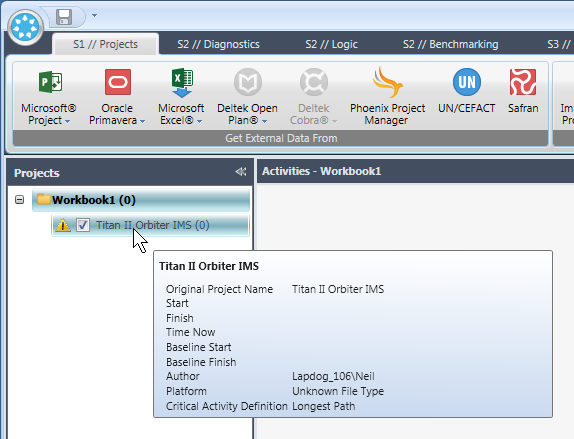
Having imported your Primavera P6 file, you will see it listed below the Workbook header. However, this is just the first step. To perform any analysis on this project, you will need to now import it to Acumen Fuse.
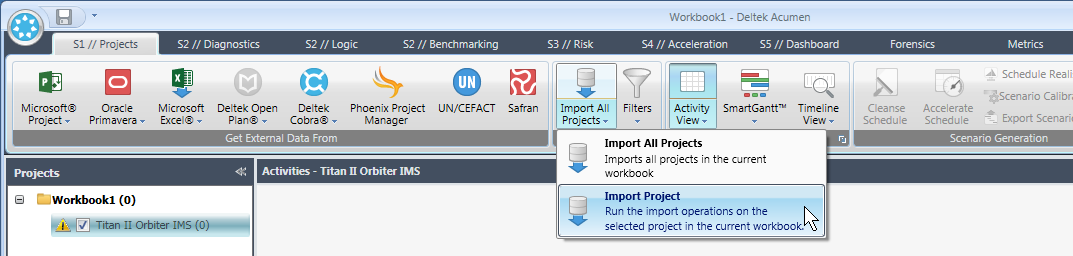
An import is performed using the Import All Projects button located in the Import section of the Projects ribbon.
With your project name checked in the workbook, click on the Import All Projects button. Again if you click on the lower half of the button, you will see there are two import options: Import All Projects (for when you have loaded more than just one project into the Workbook) or Import Project. In this example we had just one selected project so we used the second option.
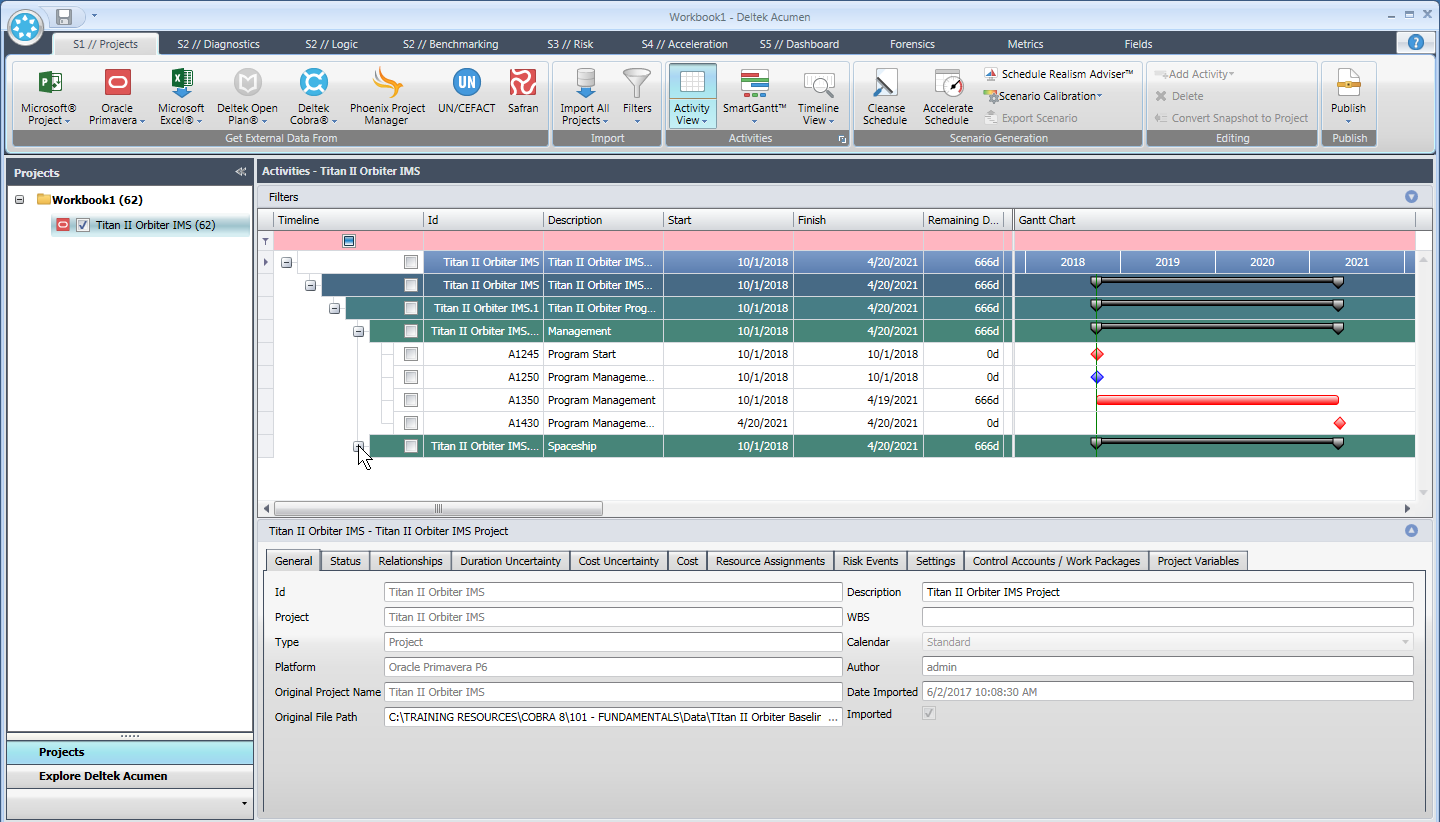
After a brief process execution, the imported project’s details appear in the table and Gantt Chart area of the Projects tab.
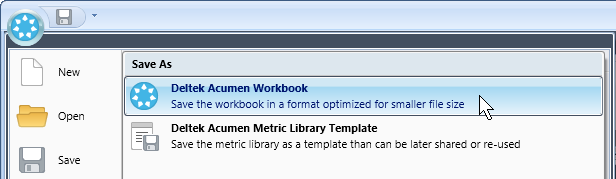
Now would be a good time to go to the Acumen Fuse menu and save your Workbook.
Having saved your workbook, you can drill down through the various elements of your project to verify the data. You are now ready to perform a diagnostic on your schedule.
Acumen Fuse Diagnostics Tab
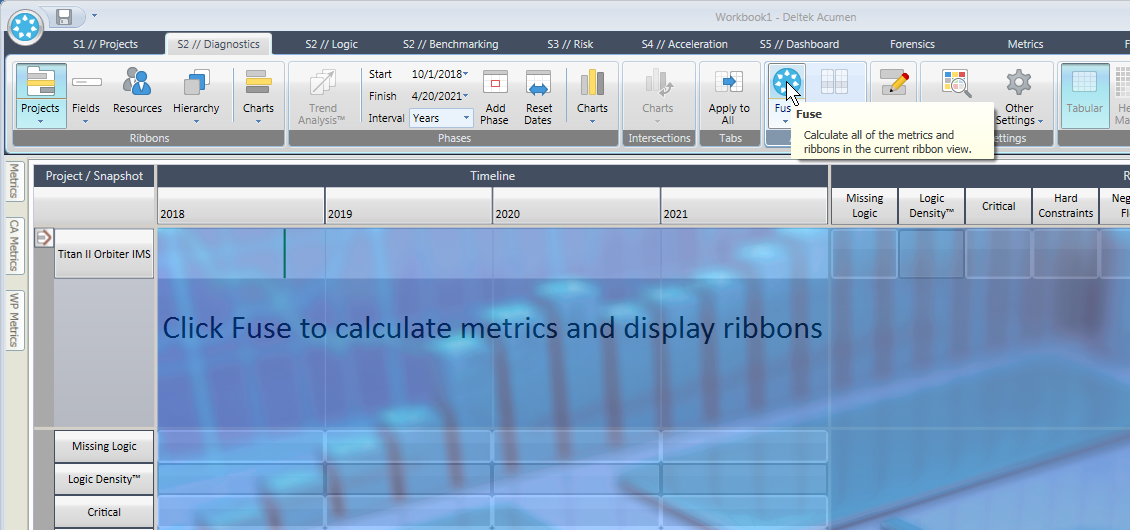
The next step in this process is to click on the Diagnostics tab to access the diagnostic tools in Acumen Fuse. Once you open the diagnostics tag you see a timeline and a ribbon analyzer. You also see a prompt to click Fuse to calculate metrics and display ribbons. Go to the analyze tool group and click on the fuse button.
After a few moments the analysis is completed and you will see the project’s score in the ribbon analyzer along with a detailed table of scores set out across the project timeline.
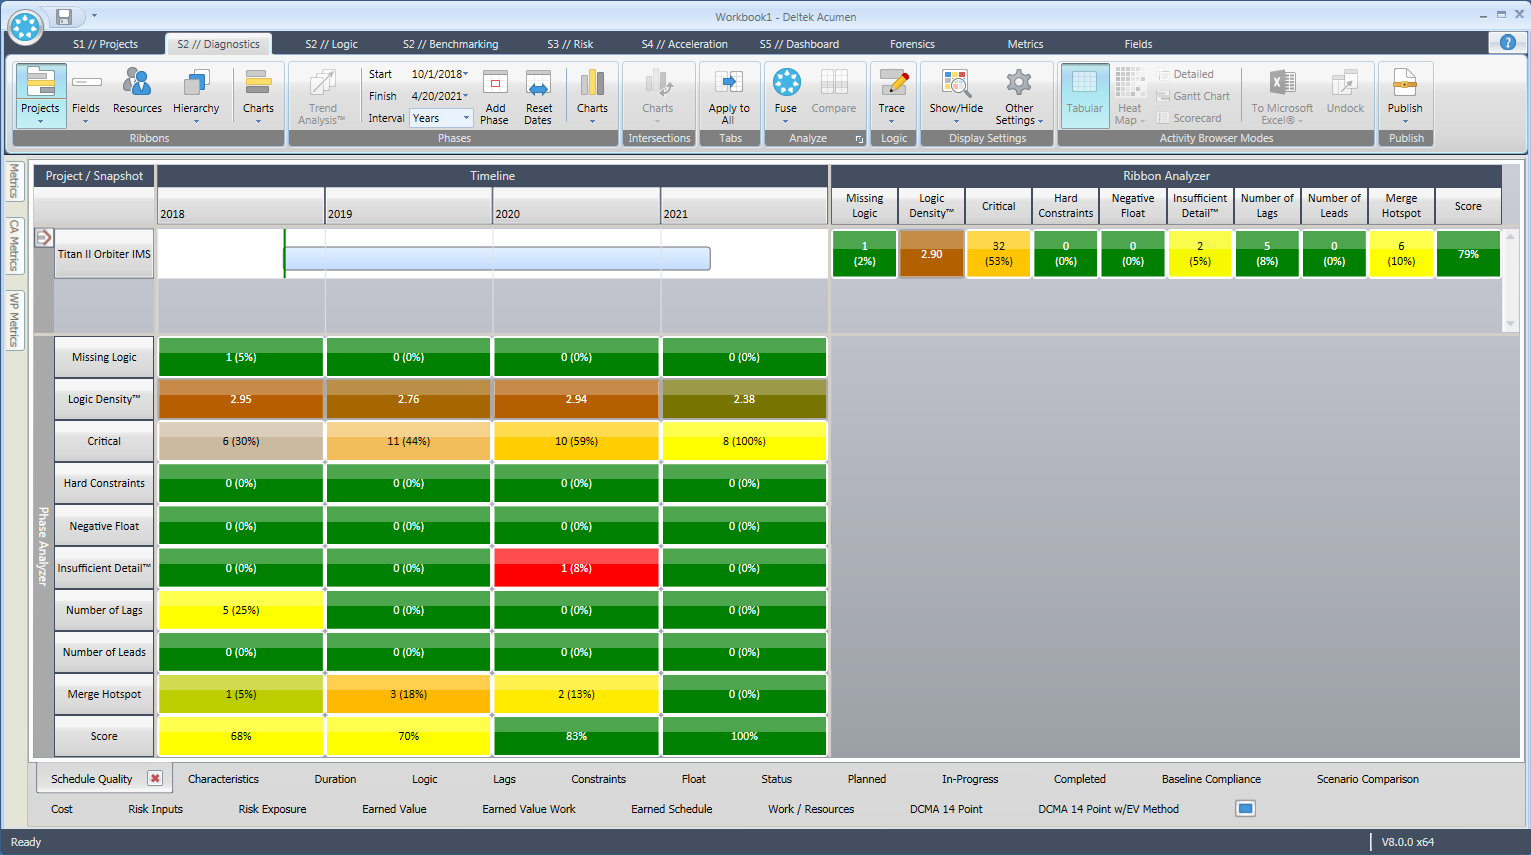
In the top right you can see the overall score for the project. In this example the project scored 79%.
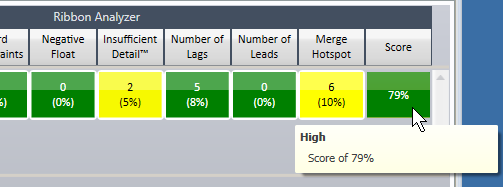
This is considered a high score for the project. We can also see a summary of how that score was derived in the other cells to the left in the ribbon analyzer. Let’s talk about some of those scores and what they mean.
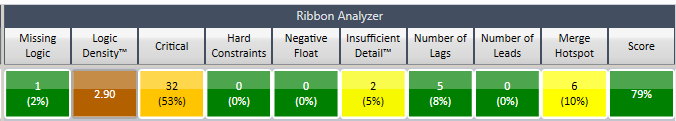
Missing Logic – One activity, 2% of the overall activities is missing either a predecessor or successor.
Logic Density – 2.9 indicates the average number of relationships per activity. In theory this should be two or more.
Critical – this metric tells us there are 32 critical activities in the project so just over 50% of the project activities are critical.
Hard Constraints – the project contains no hard constraints. Most guidelines discourage the use of hard constraints.
Negative Float – the number of activities with a negative float value. A gain we have a zero in this project example which is a high score. Baseline projects, such as our example, should never contain negative float.
Insufficient Detail – our sample project has two activities that are considered long duration. That is activities that are 10% of the projects overall duration or greater. If these are level of effort activities or long lead procurement items, that may be acceptable. Our project therefore has barely passed this metric.
Number of Lags – a sample project has five activities with lags on them which is giving a score of 8%. This is well below the 25% guideline.
Number of Leads – leads (or negative lags) in our sample schedule equal zero. Typical guidelines discourage the use of negative lags and in fact some contracts outlaw them completely.
Merge Hotspots – areas of the project where there are a high number of predecessors on an activity. Our project is showing six merge hotspots giving us a medium to high score on this metric.
In the timeline area is a table showing how the schools breakout across time phased periods in the project due to the length of this project it showing them in years. This helps you analyze which areas of the project displaying some of the issues summarized in the ribbon analyzer.
Finally we can create a report showing the score for our project in a comprehensive spreadsheet. To do this we go to the publish button at the far right of the ribbon. When we click on the publish button we see options to publish to various media including an Executive Briefing in Microsoft Word, In Microsoft Excel you are offered a ‘To Microsoft Excel’ current ribbon report, a Fuse Analyst analyst report, a Fuse Summary Metric report, and even a Deltek wInsight Analytics report.
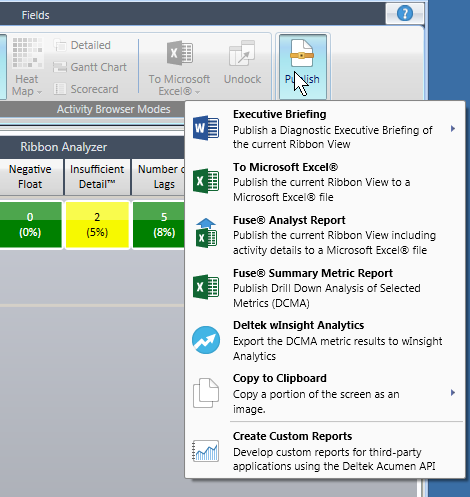
For this example we will select the Fuse Analyst Report. When we run this report, Deltek writes the information to an Excel spreadsheet as seen in the final screenshot. This multi-tab report allows you to examine your project in great detail and look for areas, or identifies specific activities, that need attention.
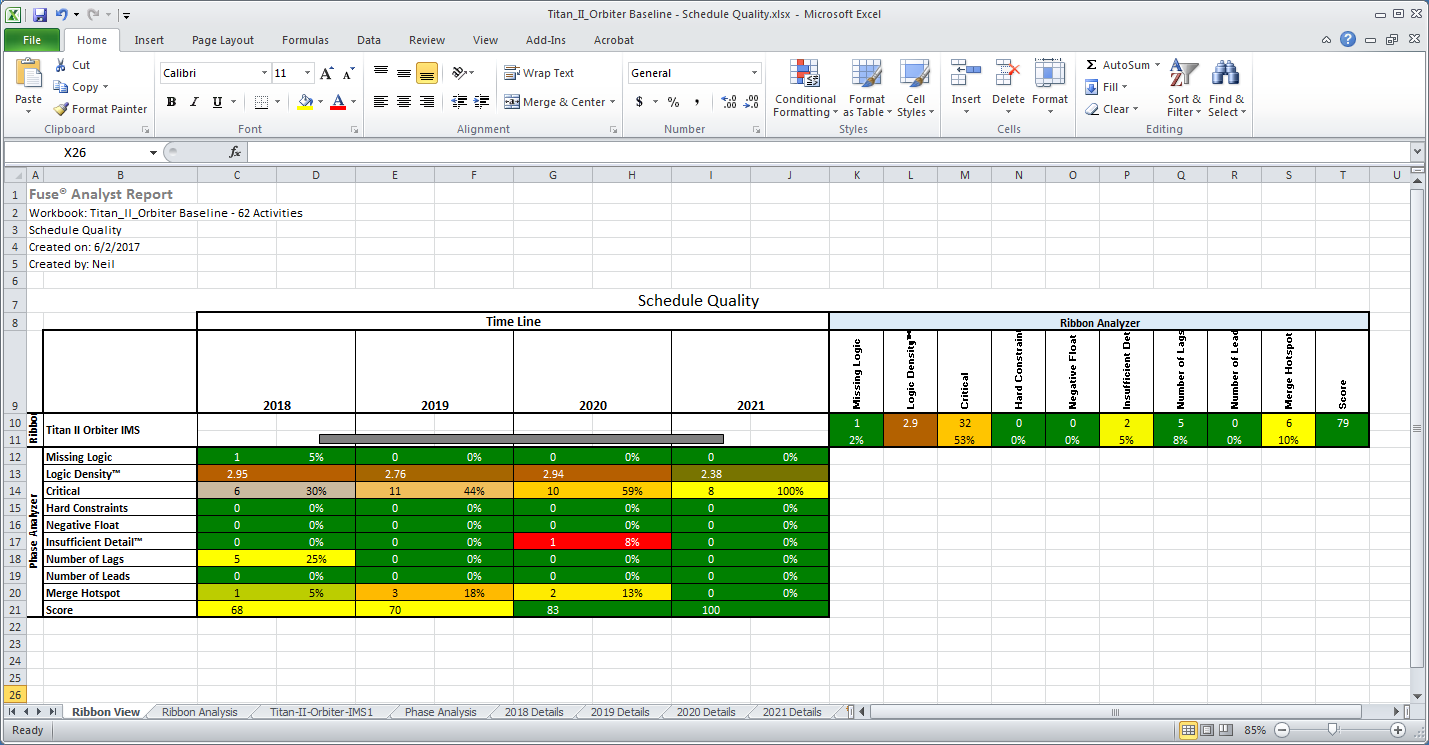
Click here to download a copy of the spreadsheet.
Summary
Deltek Acumen Fuse schedule diagnostics has been able to present a detailed analysis of a Primavera P6 schedule XER in a few simple steps. This gives you the ability to focus on areas of your schedule that may need attention before submitting that schedule to a government agency or indeed any customer. It will help you raise your organization’s standards in scheduling best practice and make sure your customers are always presented with realistic and achievable schedules that will score highly against any industry standards.
Furthermore, this is just one area of capability offered by Deltek Acumen Fuse. This application offers many other features and functions including sophisticated risk management, reporting dashboards, schedule comparisons, forensic analysis and many other features. We will be covering further acumen examples in some later articles.