The larger and more intricate the schedule the greater the challenge to understand the relationships between tasks. Finding the one predecessor among several that may the cause of slippage can quickly become tedious. But Microsoft Project has features to support displaying driving tasks.
Understanding the root cause of schedule slippage is a common dilemma in projects, and particularly large schedules. You want to quickly locate the task among many predecessors that is the driving task; the predecessor task that determines the start date of your task in question.
The driving predecessor is the task causing any slippage to its successor. Microsoft Project comes with a Task Inspector and Task Path feature for tabulating the driving predecessor and highlighting it on the Gantt chart.
This article demonstrates the Task Inspector and Task Path features for inspecting and displaying driving tasks as well as predecessors and driven successors.
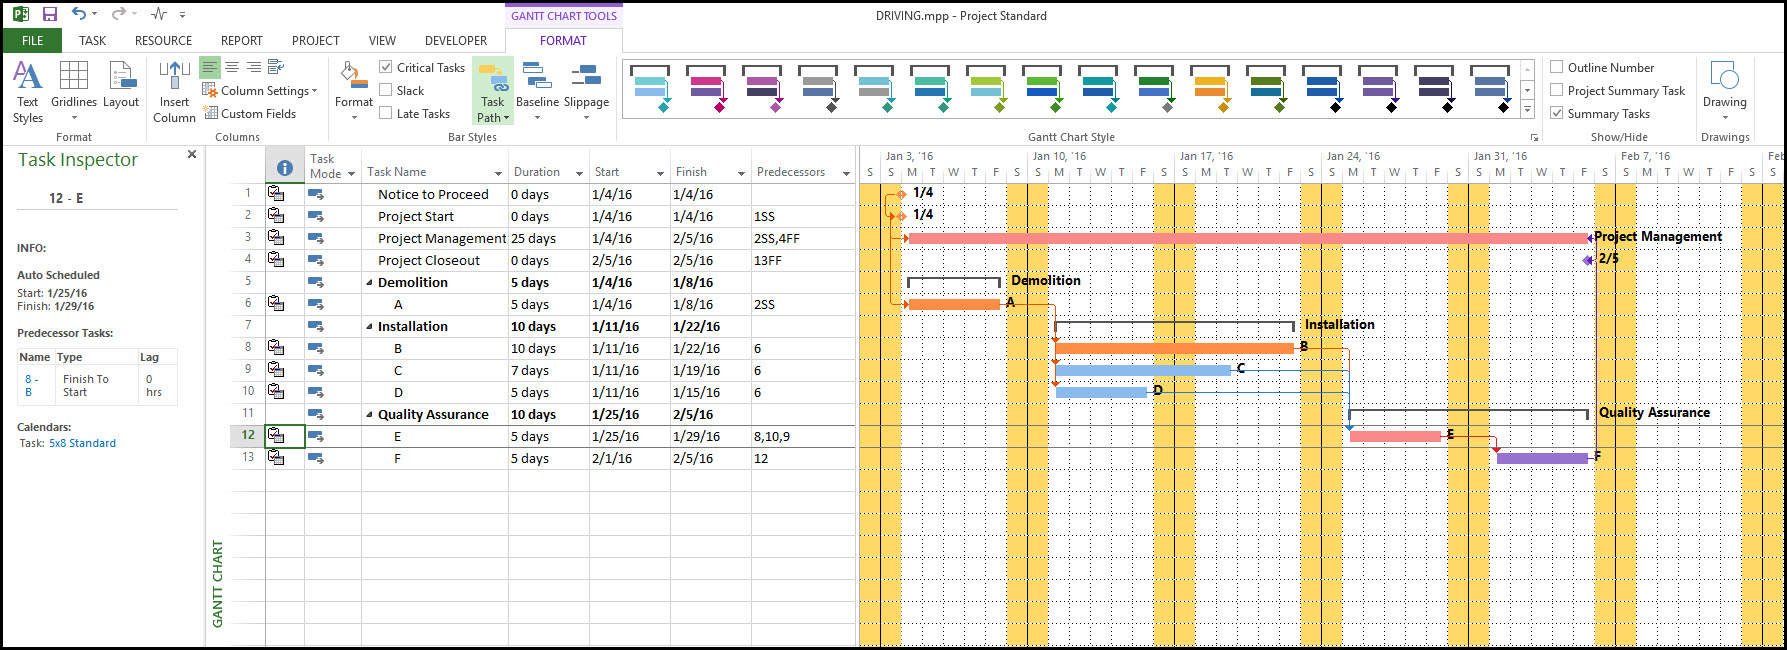
Our demonstration project is displayed in Figure 1.
 Figure 1
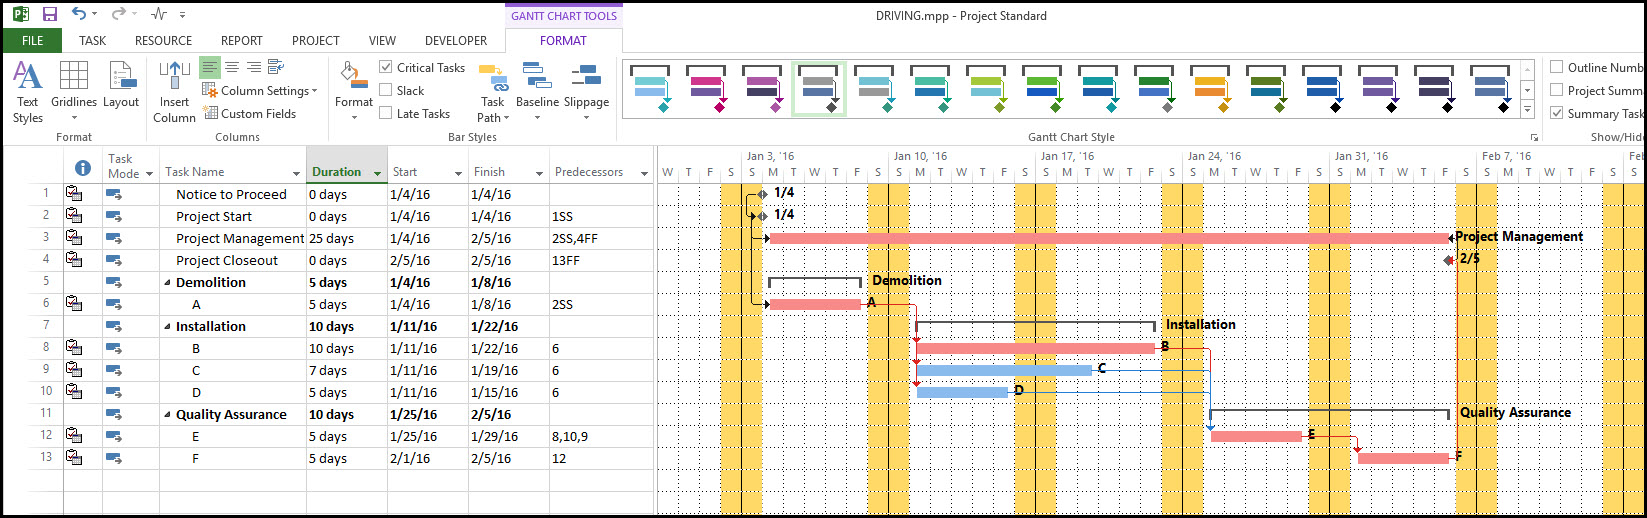
Note, in particular, task E, which has three predecessors, tasks B, C, and D. We want to find out which of these three predecessors is the driving predecessor of task E. Again, the driving predecessor of task E determines its start date, and would be the likely cause of task E start date slippage.
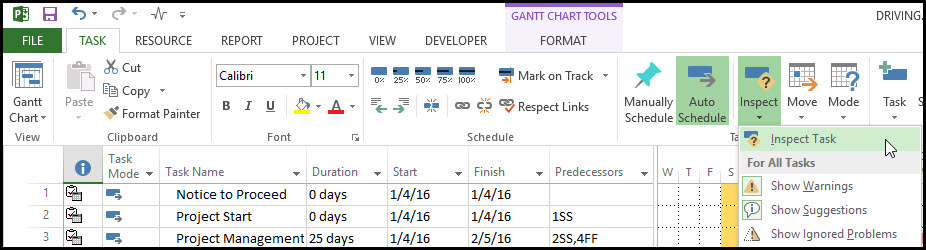
Let’s first tabulate Task E’s driving predecessor. Highlight task E and select the Task tab, Task ribbon group, Inspect icon, and Inspect Task (from the drop down menu), Figure 2.
Figure 2
The Task Inspector displays all immediate predecessors that are driving the start of task E, Figure 3.
Figure 3
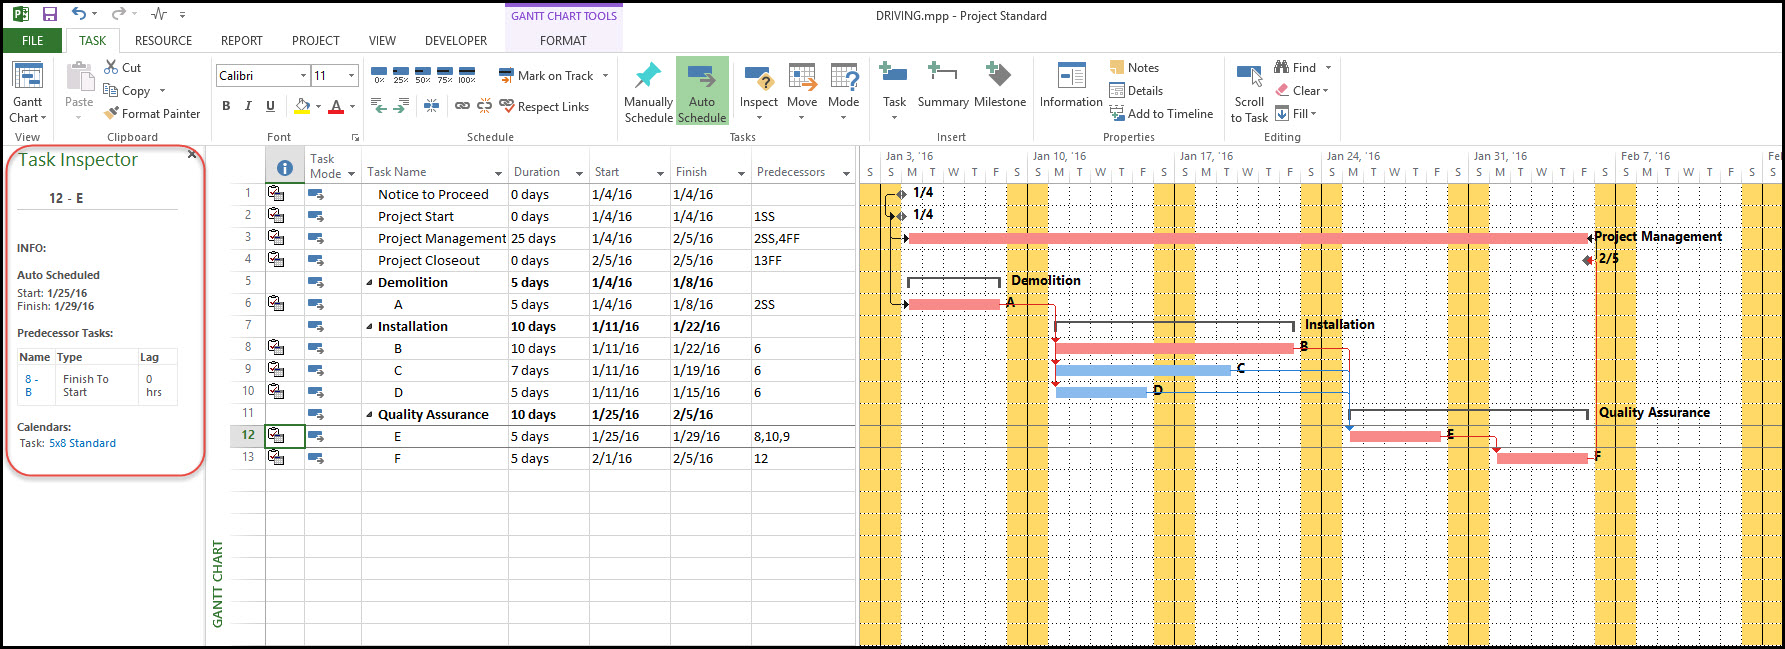
As tabulated by the Task Inspector, task E has only one driving predecessor, task B. Yes, it is possible for a task to have more than one driving predecessor. Note that tasks C and D are also predecessors of task E.
They, however, are not tabulated because they are not driving the start date of task E. In Figure 4 we have a slightly altered schedule; task C is now 10 days duration making its finish date equivalent to task B.
Figure 4
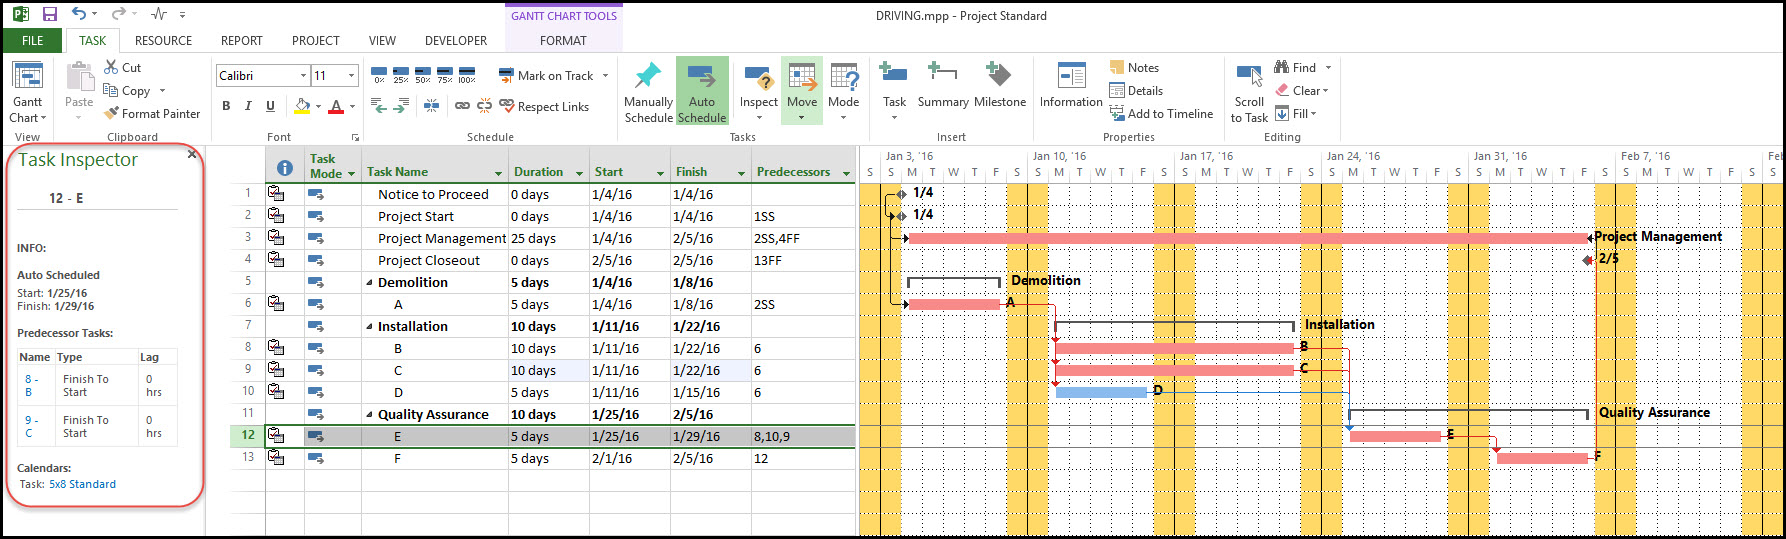
Observe in Figure 4 that our Task Inspector now lists tasks B and C as the predecessors to task E; both tasks B and C are now driving the start date of task E.
Tabulated driving predecessor data is helpful, particularly when a schedule takes up more than one page. But sometimes it is nice to view tasks and their corresponding driving predecessors on the Gantt chart.
This is possible by implementing the Task Path feature. Highlight task E and select the Format tab, Bar Styles ribbon group, Task Path icon, and Driving Predecessors, Figure 5.
Figure 5

The resulting Gantt chart is displayed in Figure 6.
Figure 6
The driving predecessors of task E are shaded the color orange. These are all the task E predecessors whose delay would cause a corresponding delay in the start of task E.
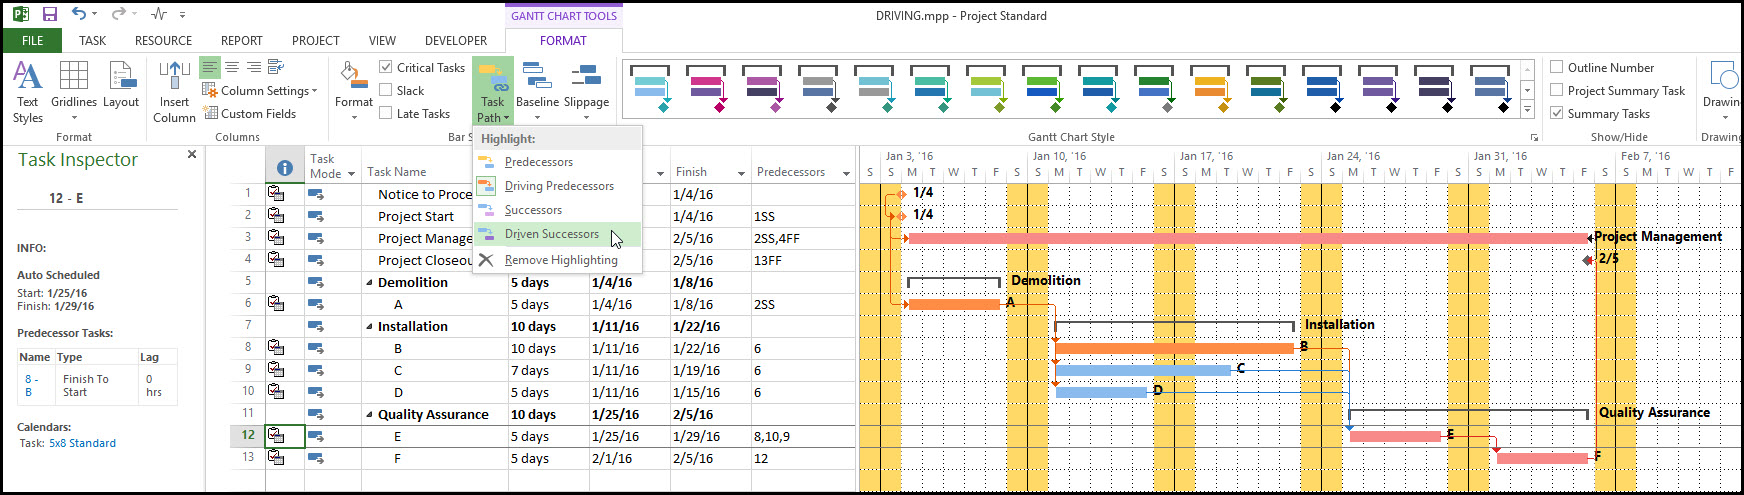
Now we want to highlight the task E driving successors, Figure 6. Again, highlight task E and select the Format tab, Bar Styles ribbon group, Task Path icon, and Driven Successors. The driven successors of task E are color shaded purple, Figure 7.
Figure 7
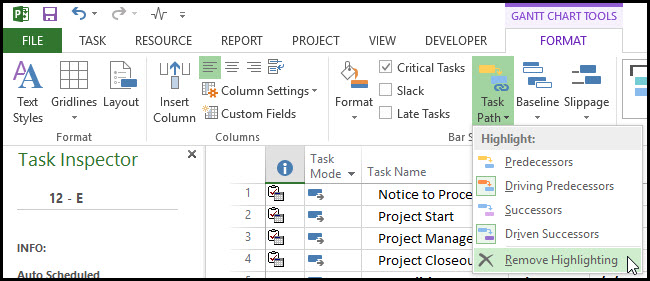
Driven successors to task E are task F and task ‘Project Closeout’. Any delay in task E would cause an equivalent delay in these driven successors. Once you complete the driving and driven analysis, remove Gantt chart highlights by selecting Format tab, Bar Styles ribbon group, Task Path icon, and Remove Highlighting, Figure 8.
Figure 8
Summary
Microsoft Project 2013 supports the often tedious process of locating displaying driving predecessors with two features: the Task Inspector and Task Path. The Task Inspector tabulates all immediate driving predecessors to the task in question. The Task Path feature highlights on the Gantt chart the path of driving predecessors. These are all tasks whose delay would cause equivalent slippage to the task in question.
The Task Path inspector can also highlight the path of driven successors. A delay of the task in question would cause a commensurate delay to any task along the driven successor path.