One of the beauties of the Gantt chart is that it allows you to visually see the progress of your schedule. Baselines are a way to measure this progress.
In Primavera P6 Enterprise Project Portfolio Management (EPPM) a scheduler can define two baselines for display on the Gantt chart. These are the project baseline and the primary baseline. The project baseline allows the administrator to control whom may make adjustments. The primary baseline gives the scheduler more control and is for more ad-hoc snapshots of the schedule.
This article describes how to define and plot both the project baseline and primary baseline on the Gantt chart in Primavera P6 EPPM R16.1.
We’ll start in the activities view of an open project. In Figure 1 we select Actions | Define Baselines.
 Figure 1

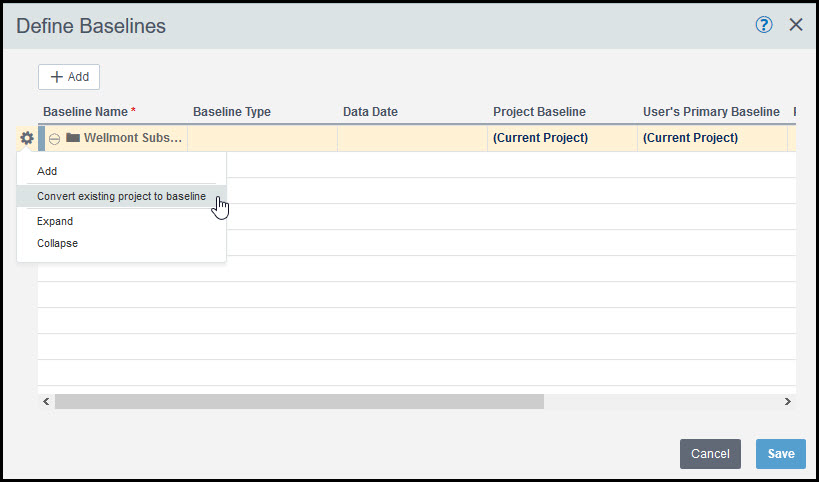
In the Define Baselines dialog we right click the setup wheel icon, Figure 2, and select ‘Convert existing project to baseline’.
Figure 2
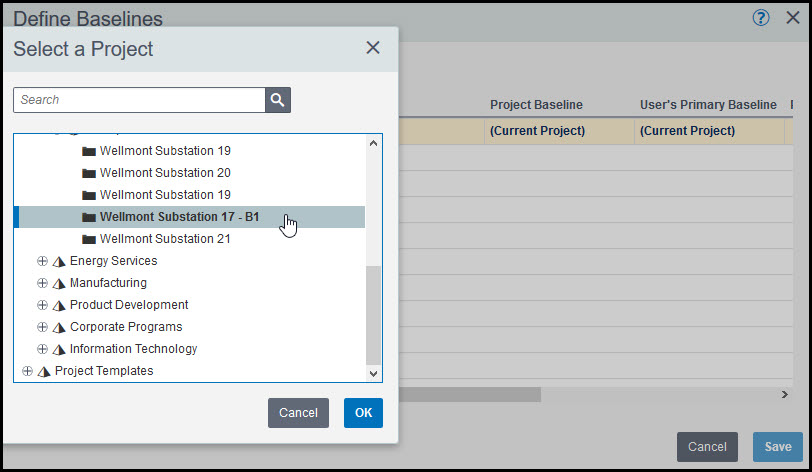
Our intention is to read in a complete project as a baseline. This project describes the state of the schedule before any progression. In our example we select the ‘Wellmont Substation 17 – B1’ project, Figure 3.
Figure 3
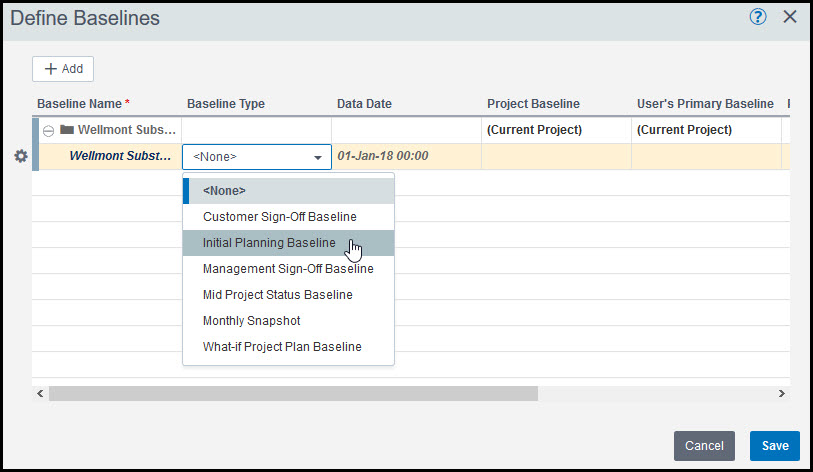
Primavera P6 EPPM reads in this project as a new baseline. We select ‘initial planning baseline’, Figure 4, as the type.
Figure 4
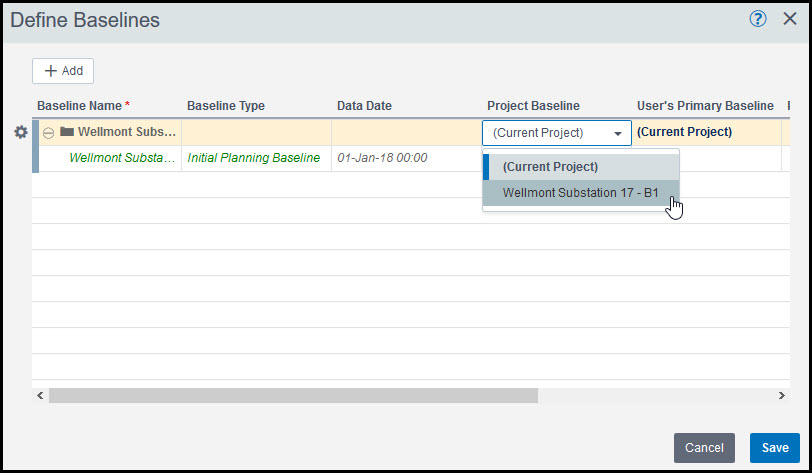
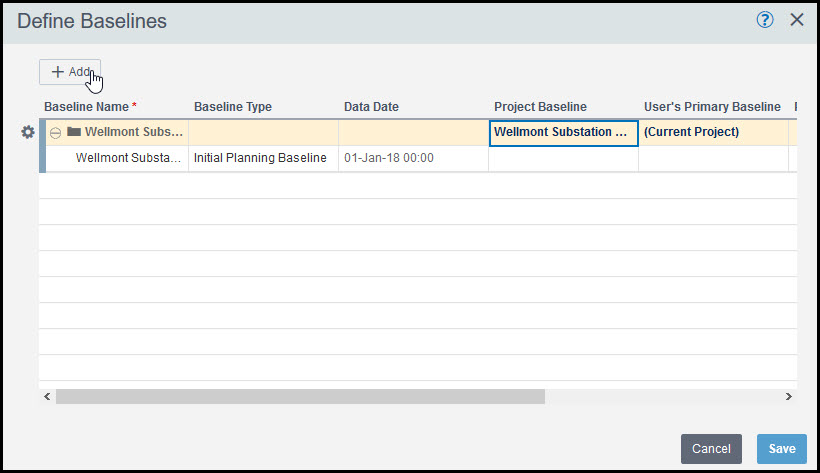
In Figure 5 we assign this baseline to the project baseline, Figure 5.
Figure 5
Next we select + Add, Figure 6, to create a new baseline, which takes a snapshot of the schedules’ current situation.
Figure 6
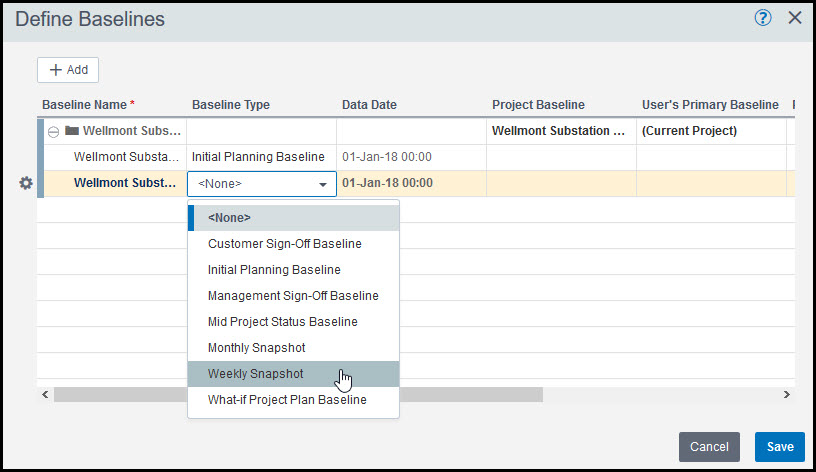
In Figure 7 we select the baseline type, weekly snapshot.
Figure 7
In Figure 8, we assign this baseline schedule snapshot to the user’s primary baseline.
Figure 8

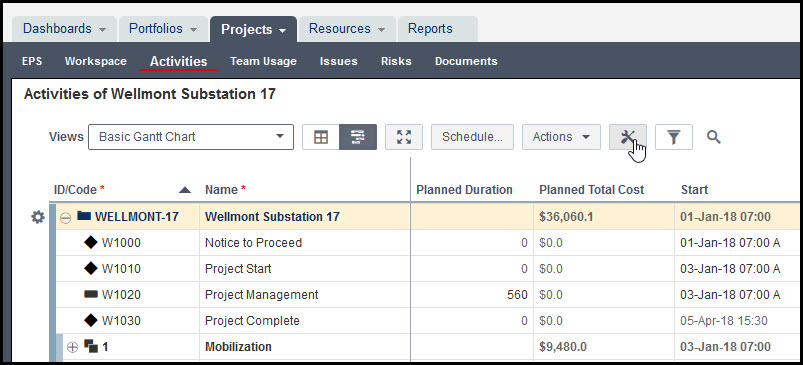
Now we select customize view, Figure 9, so we can describe how we want these two baselines to appear on the Gantt chart.
Figure 9
In the Customize View – Basic Gantt Chart dialog we select Bars, Figure 10.
Figure 10

Select + Add and from the drop down menu select Bar, Figure 11.
Figure 11
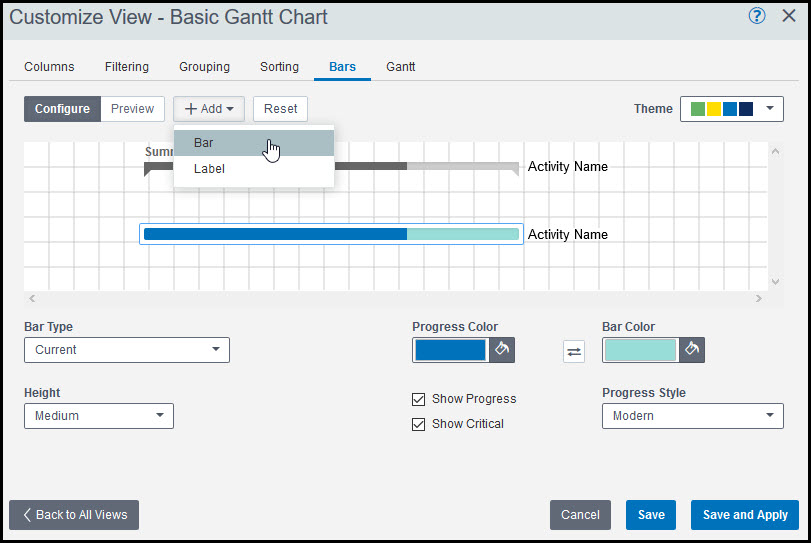
This adds a new bar below our activities. We assign this bar the project baseline type, Figure 12.
Figure 12

Repeat to add another bar, and assign it to the user’s primary baseline bar type, Figure 13.
Figure 13
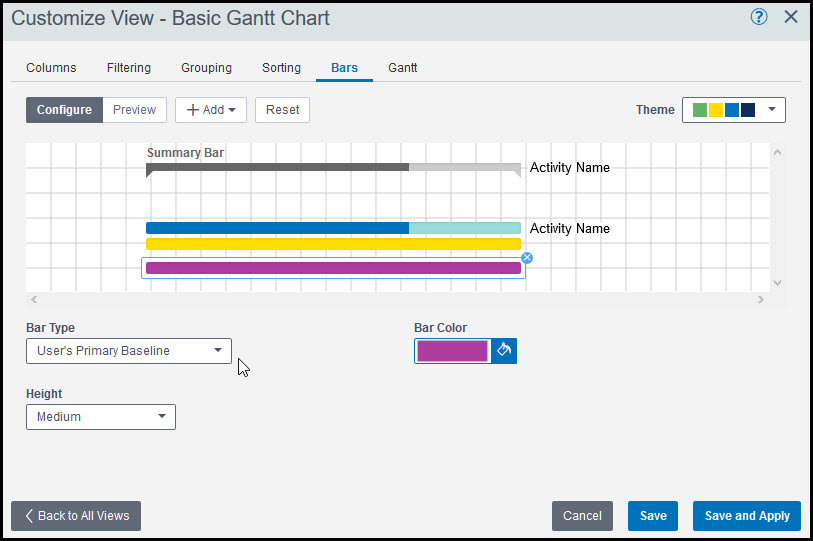
Now our baselines have been defined, assigned, and customized for the Gantt chart. The schedule displaying both the project baseline (yellow bar) and user’s primary baseline (magenta bar) is displayed in Figure 14.
Figure 14
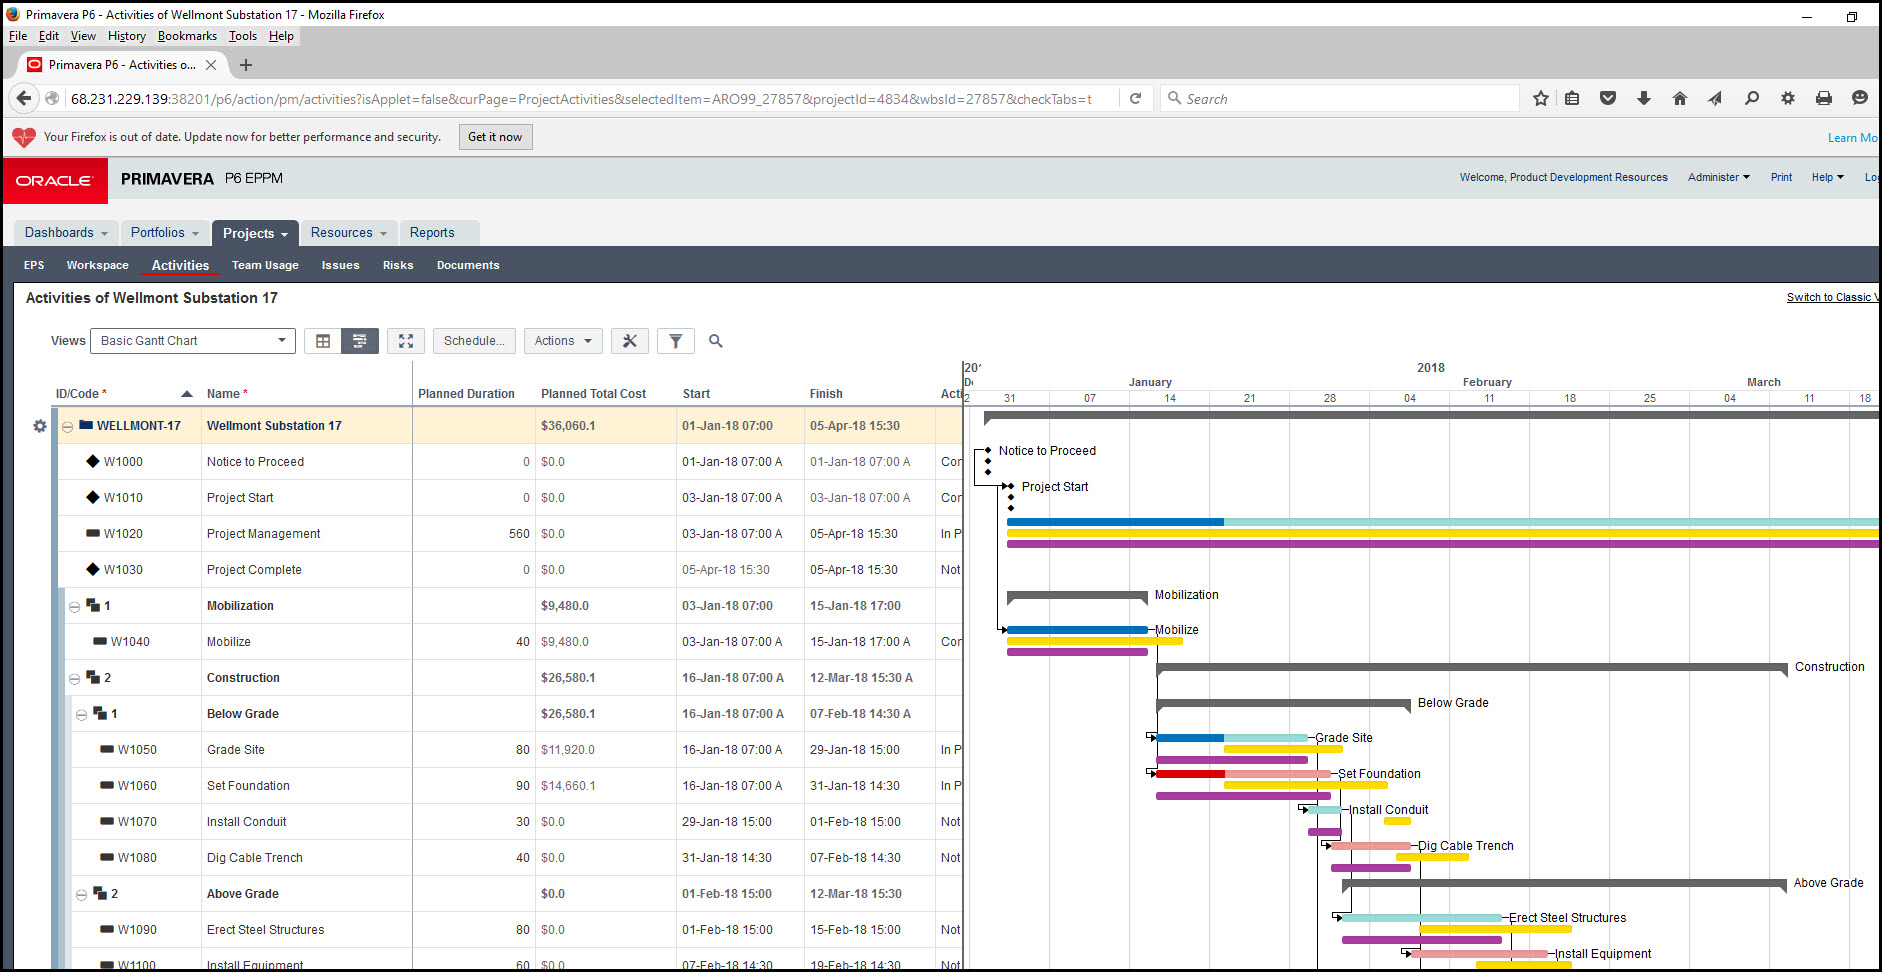
Note that our schedule has been progressed two weeks.
Summary
Primavera P6 EPPM Release 16.1 is capable of displaying a project baseline and a primary user’s baseline on the Gantt chart. The project baseline is controlled by the administrator and may not be available for the scheduler to change. The project baseline usually has change management control procedures, and normally displays the project before any schedule progression.
The scheduler has more control over the primary user’s baseline. Each respective baseline can be assigned any one of a number of baseline types. Schedulers can add additional baseline types in Administer | Enterprise Data > Projects > Baseline Types.