How to display free float and total float Gantt Chart bars in Microsoft Project. Total float is important because it specifies how many days a task can postpone without delaying the entire schedule. A lesser known, but helpful tool is free float, which tells how many days a task can postpone without delaying a successor task.
Total float measures the potential for project schedule delays. Free float more stringently warns of a task’s potential for delaying other related tasks. Most scheduling software is helpful because it lists both total float and free float data. But the beauty of scheduling software is its ability to describe schedule dynamics in a pictorial Gantt chart.
Displaying both the total float and free float of tasks on the Gantt chart provides the scheduler with greater insight into schedule flexibility. In Microsoft Project both float bars may be displayed directly on the Gantt chart supporting more in-depth schedule analysis.
This article describes how to display both total float and free float on the Gantt chart in Microsoft Project 2013.
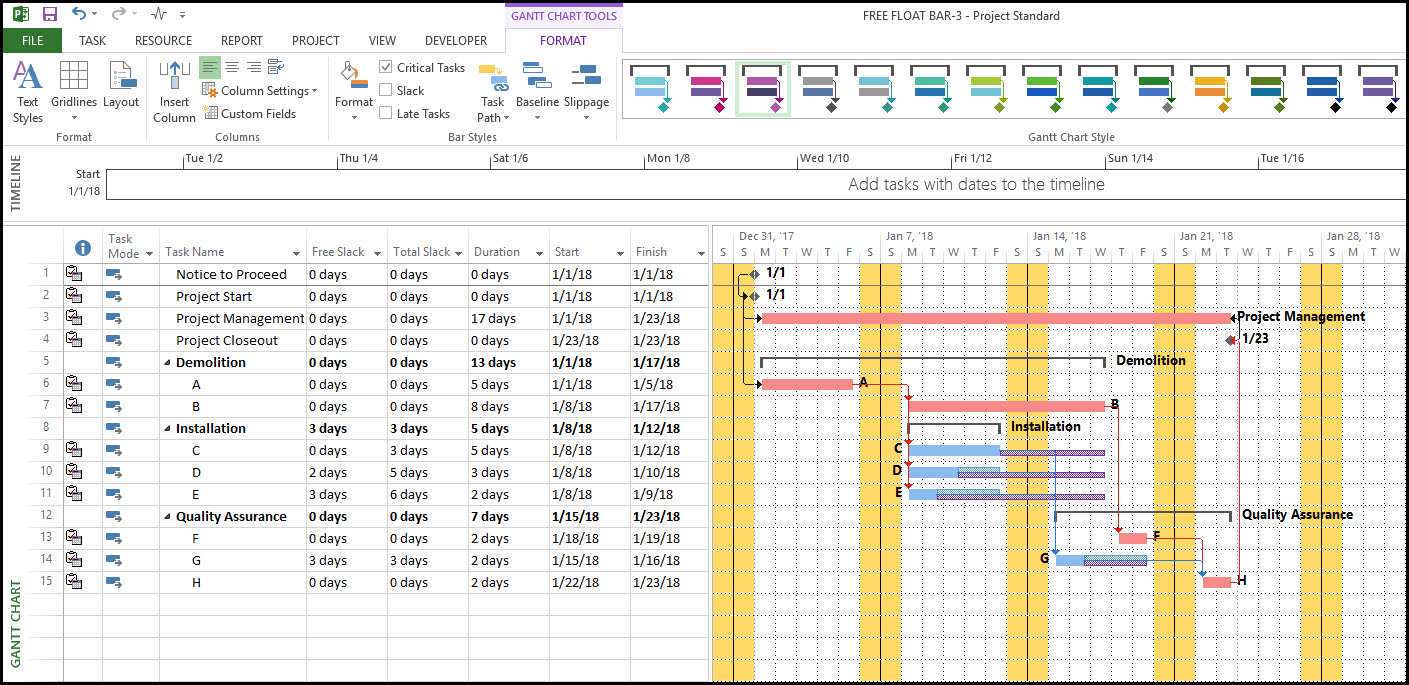
We have in Figure 1 our demonstration project.
 Figure 1
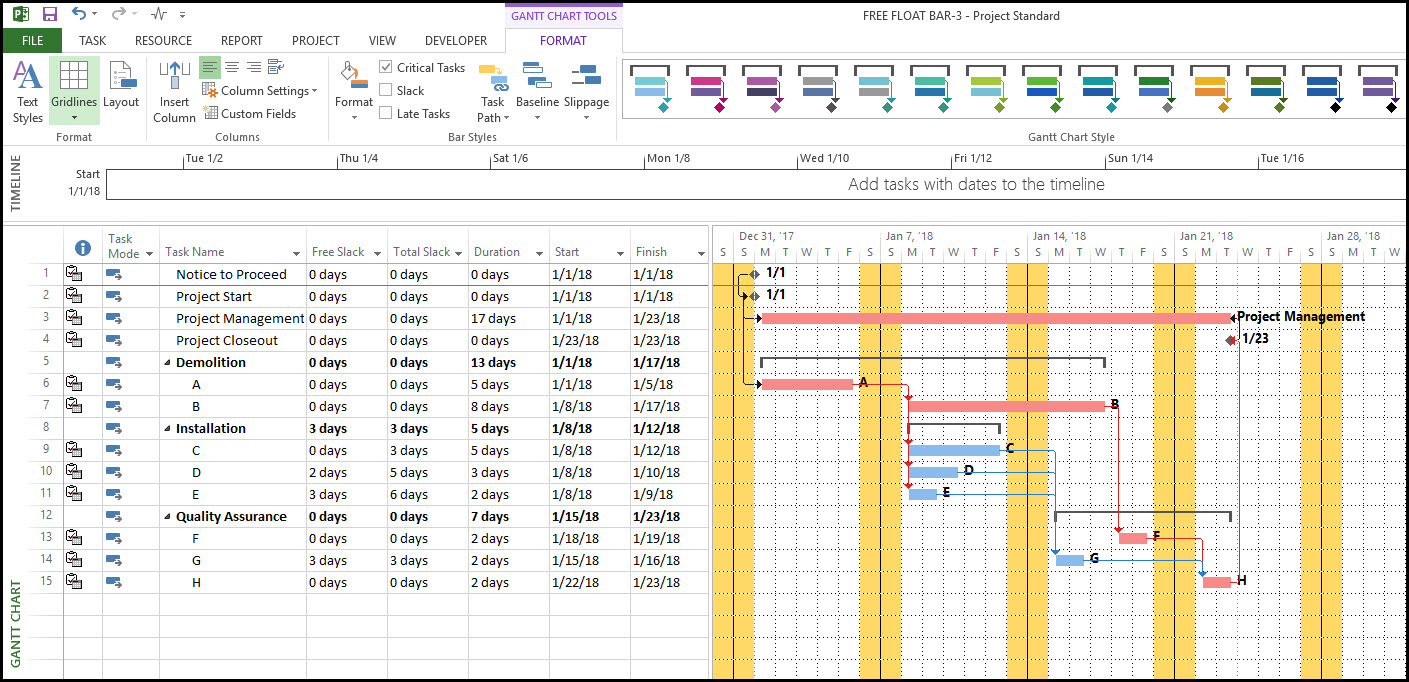
Note in particular the ‘Free Slack’ and ‘Total Slack’ data columns, which are Microsoft Project’s terminology for free float and total float. The most important tasks to watch are those that have zero total float values. These tasks cannot delay without postponing the entire project. Schedulers may also want to locate tasks that cannot linger without delaying related successor tasks. Here look for tasks that have zero free float values.
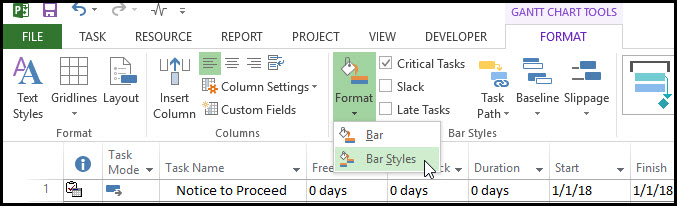
Zero total float and free float tabulated values provide sufficient warning of potential task or schedule delays. However, more insight into schedule flexibility is achieved by displaying total float and free float on the Gantt chart. To display both total float and free float on the Gantt chart select Format tab, Bar Styles ribbon group, Format, and Bar Styles, Figure 2.
Figure 2
In Figure 3 we created a bar to display the total float of all normal tasks.
Figure 3
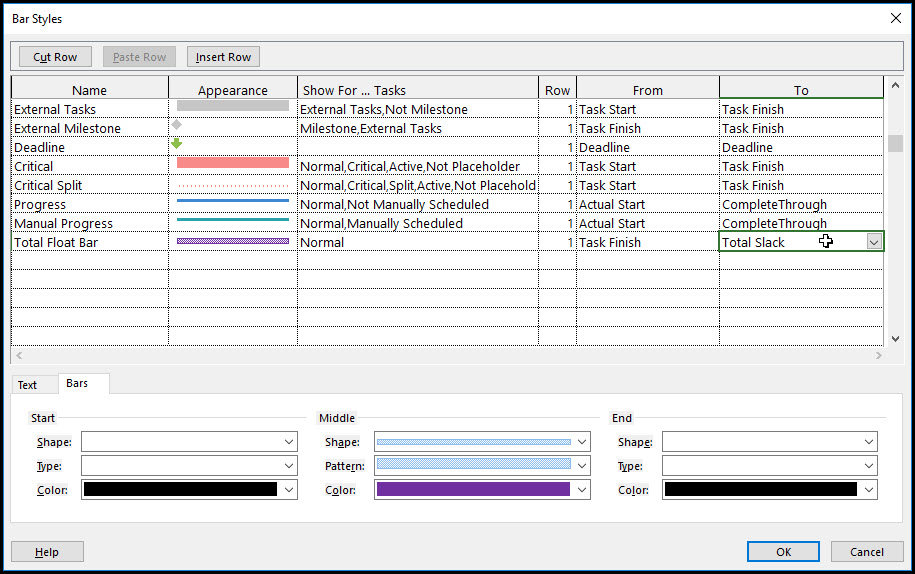
Note the bar shape and color in the appearance column. The key to displaying the total float bar is to set the ‘From’ parameter to ‘Task Finish’ and the ‘To’ parameter to ‘Total Slack’. Let’s now create a bar to display free float on the Gantt chart, Figure 4.
Figure 4
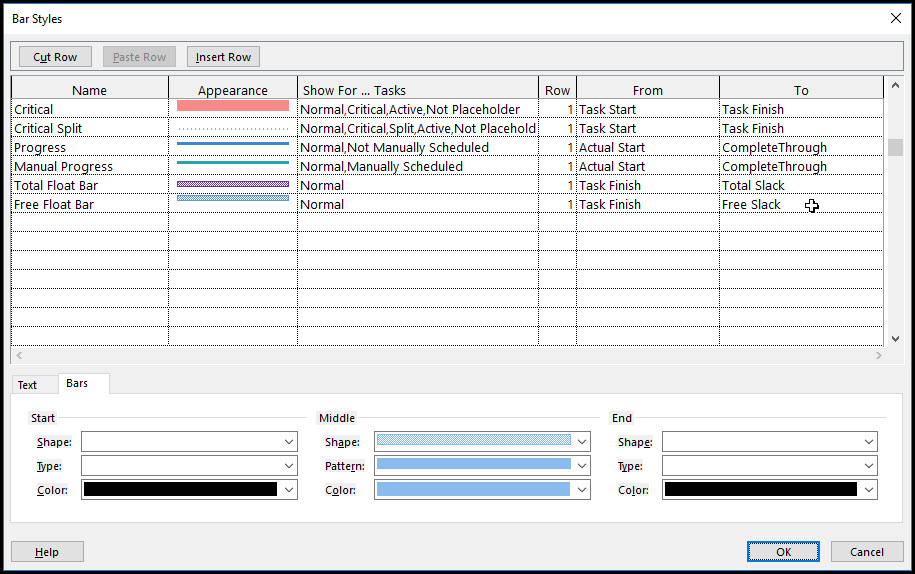
Again, note the bar shape and color. The ‘From’ parameter is, again, ‘Task Finish’, and the ‘To’ parameter is ‘Free Slack’, which works nicely.
The Gantt chart displaying both total float and free float is in Figure 5.
Figure 5
From this total float and free float Gantt chart view we find that task E has the most flexibility. It can delay three days without affecting successor task G, and it can delay six days without delaying the entire schedule.
We also observe that task D has schedule flexibility in relation to task G, and tasks C, D, and E have schedule flexibility in relation to critical task F. Task G’s total float and free float bars are equivalent, and may flex or adjust in relation to critical task H.
Summary
Scheduling software is great for tabulating pertinent schedule related data. But the Gantt chart pictorial provides the most insightful and quickest analysis. A graphic presentation of the critical path provides the most complete view of the pathway forward. And supplemental total float and free float Gantt chart bars describe task flexibility in relation to the entire schedule and other successor tasks.
Microsoft Project 2013 supports total float and free float graphic bars. You may want to adjust the non-critical task bar name labeling from right to left to provide room for insertion of total float and free float bars.