It’s very common for schedules that have a contract deadline date that does not match the project’s projected completion date. In these cases, one thing folks want to do is monitor both in relation to each other.
Projects have deadlines; it’s a fact of project management. One main value of scheduling software is that you can monitor your project’s projected completion date versus the deadline, i.e. contract completion date. Primavera P6 EPPM R16.1 does not have a deadline feature. But with a little ingenuity we can highlight a deadline date in relation to the project’s current projected completion date.
This article demonstrates one approach in P6 EPPM R16.1 to monitoring a project’s contract deadline in relation to its projected completion date.
We have displayed in Figure 1 our demonstration schedule.
 Figure 1
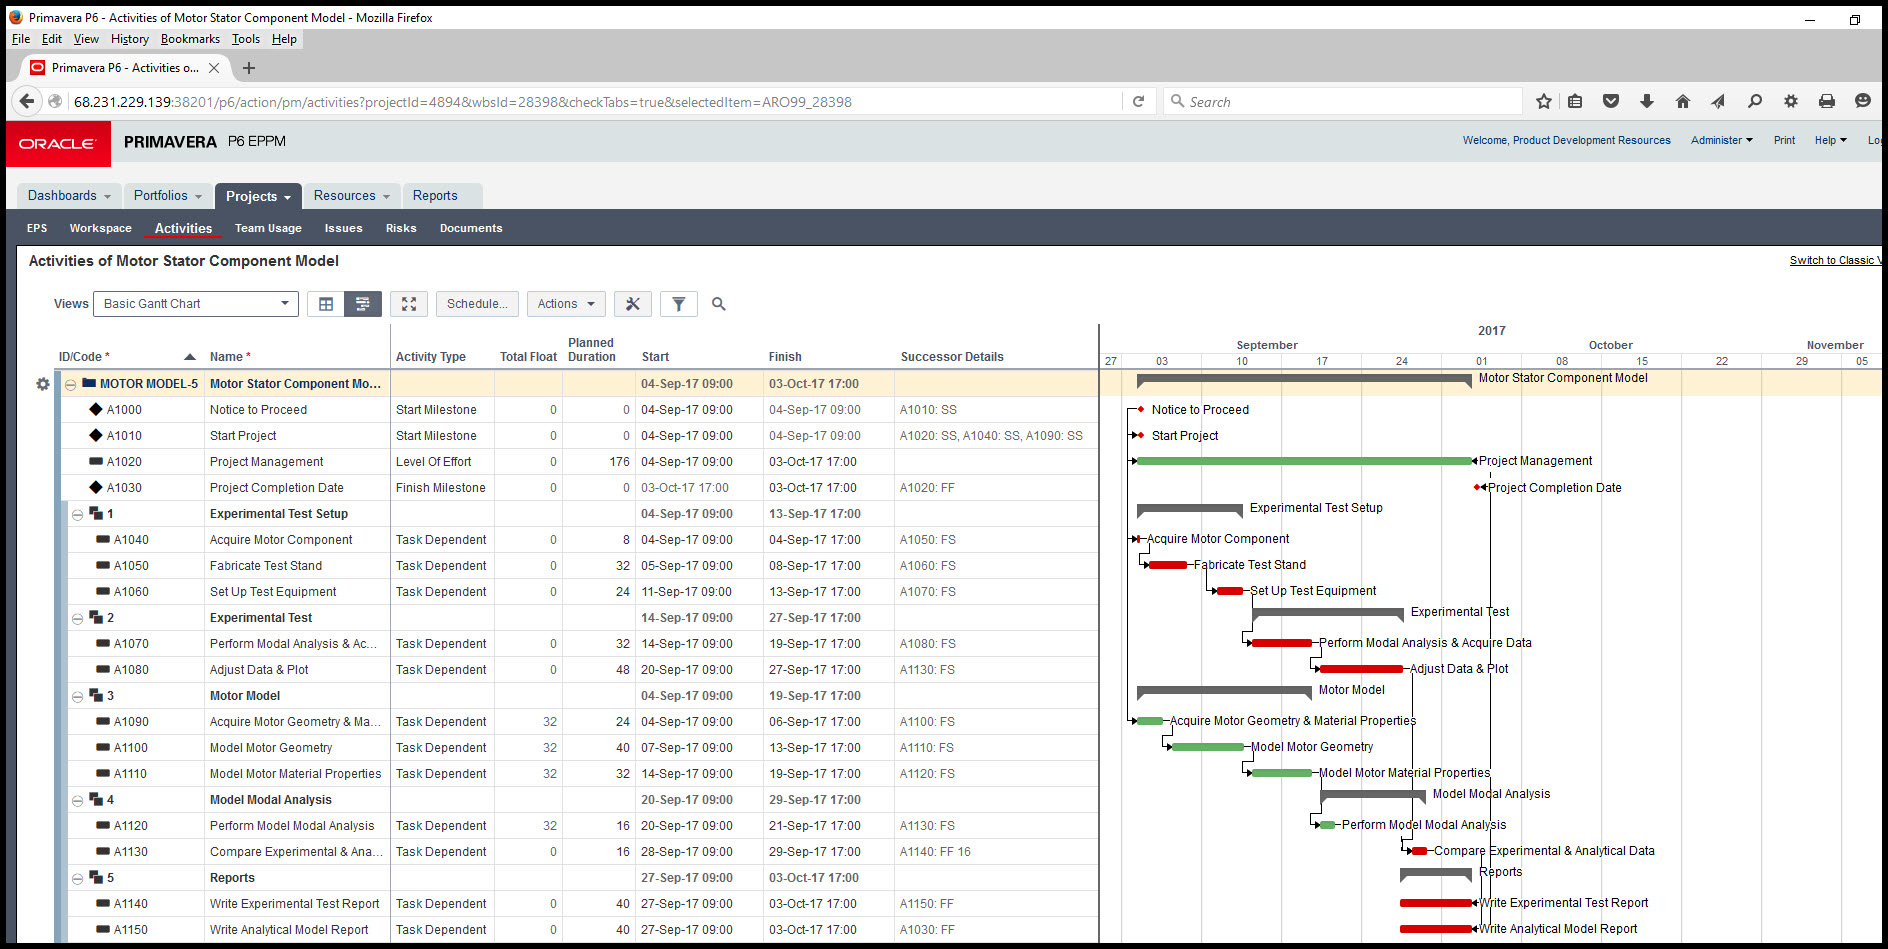
This schedule was for a motor modeling effort that required both experimentation and analytical modeling. The experimental path is critical and the modeling path non-critical. At present critical activities are defined as tasks that have zero total float.
Currently, our schedule’s Gantt chart shows the projected ‘project completion date’. But we would like our Gantt chart to additionally display the project deadline or ‘contract completion date’ for comparison. We would think displaying the deadline would be as simple as adding a finish milestone for the deadline. Let’s go ahead and try this, although it turns out to be more complicated.
Figure 2 displays our insertion of a ‘contract completion date’ with a finish on primary constraint to fix it in place.
Figure 2

We recalculate the schedule, and we find in the resulting Figure 3 that we have now lost our critical path.
Figure 3
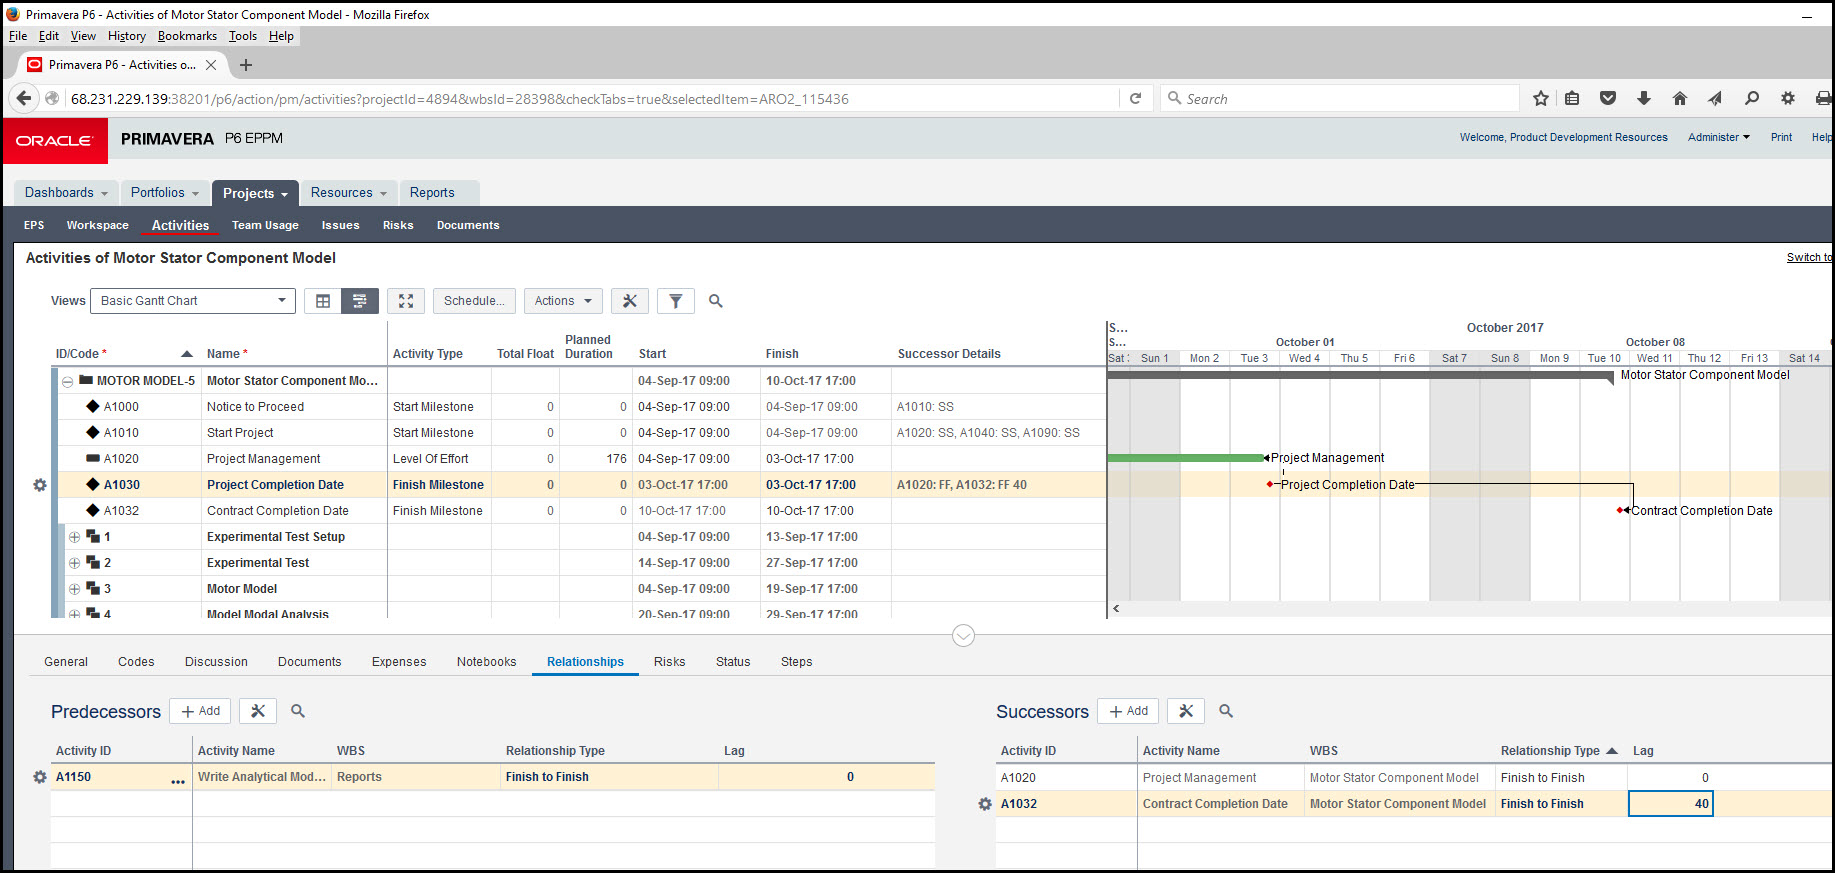
Not good. Our deadline has generated positive total float with the ‘project completion date’ finish milestone and other activities. To regain our critical path we reengineer our schedule, in Figure 4, by inserting a finish-to-finish (FF) relationship with the 40-hours of lag separating the ‘project completion date’ from the ‘contract completion date’.
Figure 4
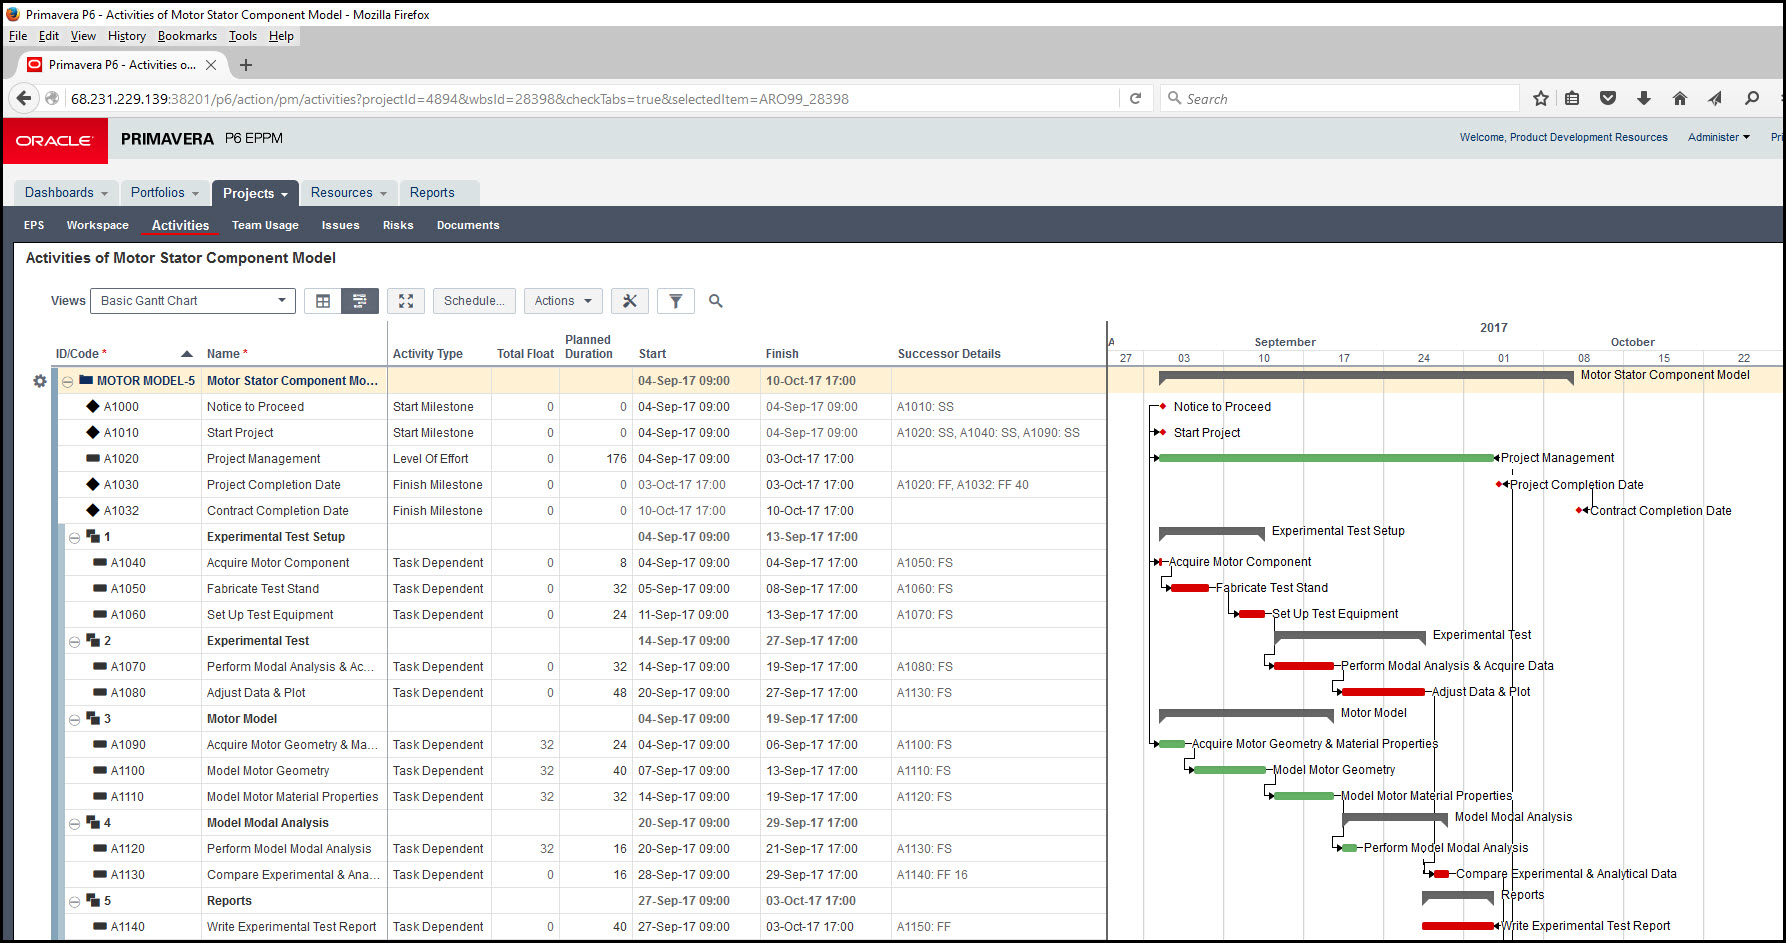
Again, we recalculate our schedule and we find in Figure 5 that we have regained our critical path.
Figure 5
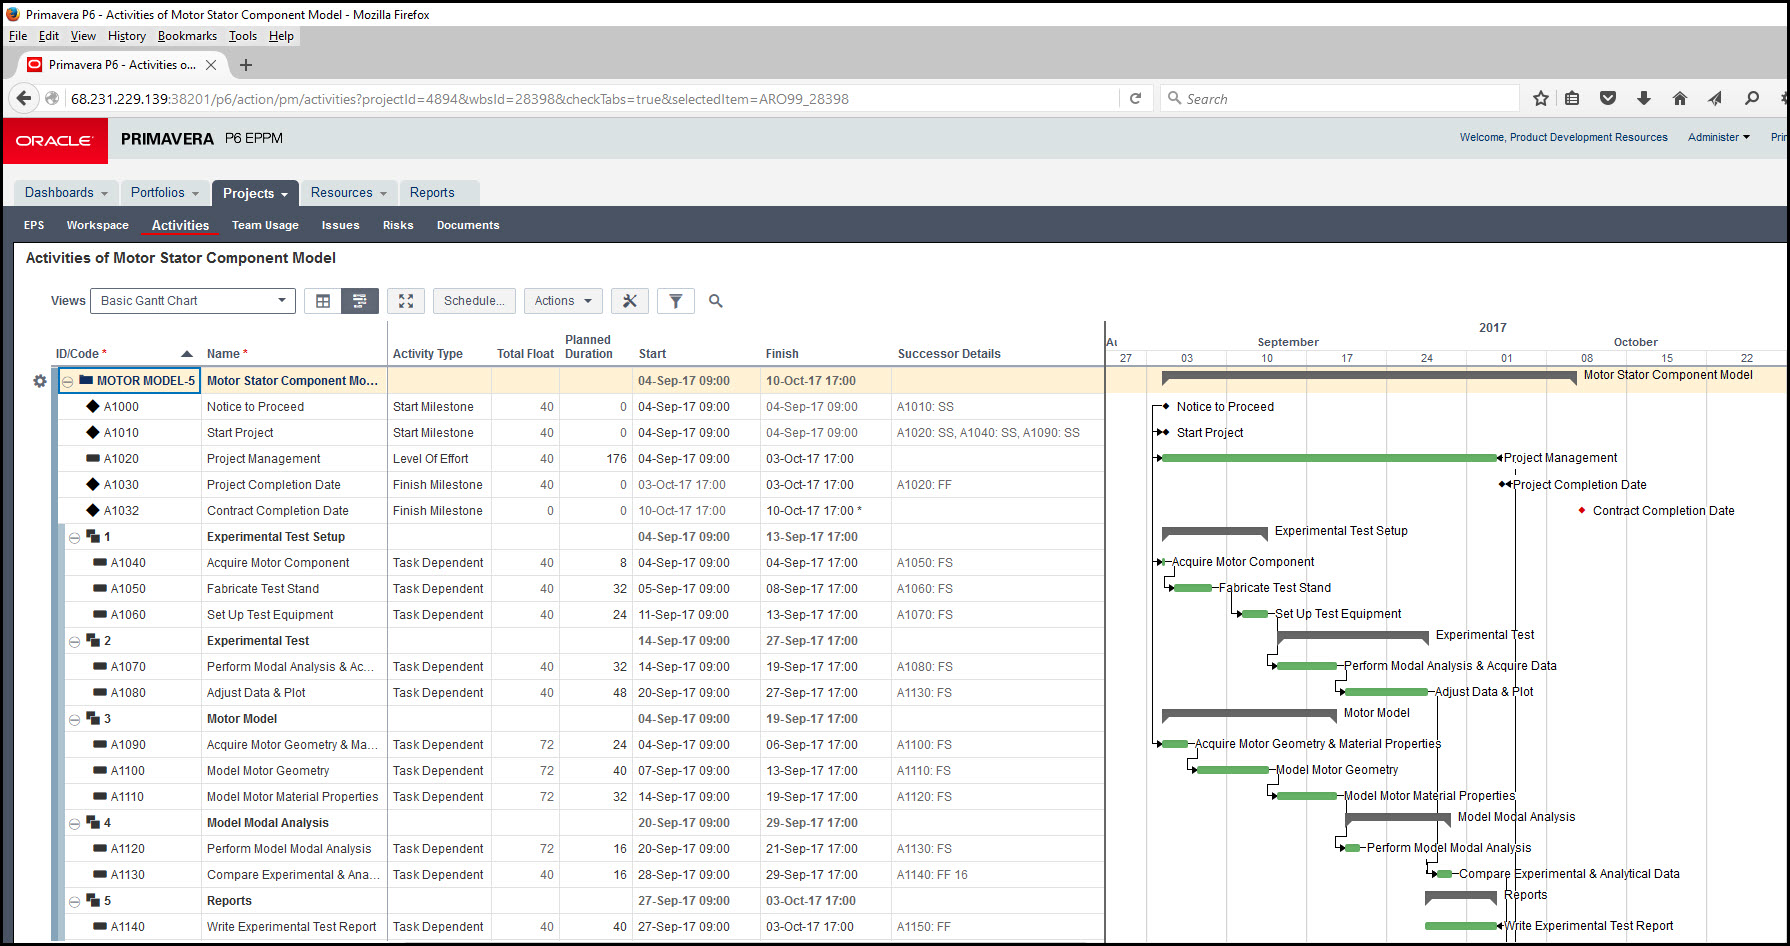
Before we proceed let’s change the definition of critical activities to ‘longest path’, Figure 6, which conforms our schedule to align to generally accepted scheduling guidelines.
Figure 6
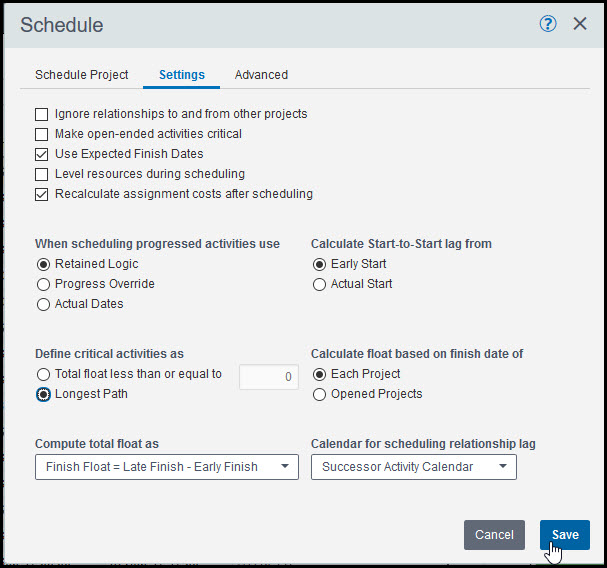
Figure 7 displays the schedule using the ‘longest path’ critical activity definition.
Figure 7
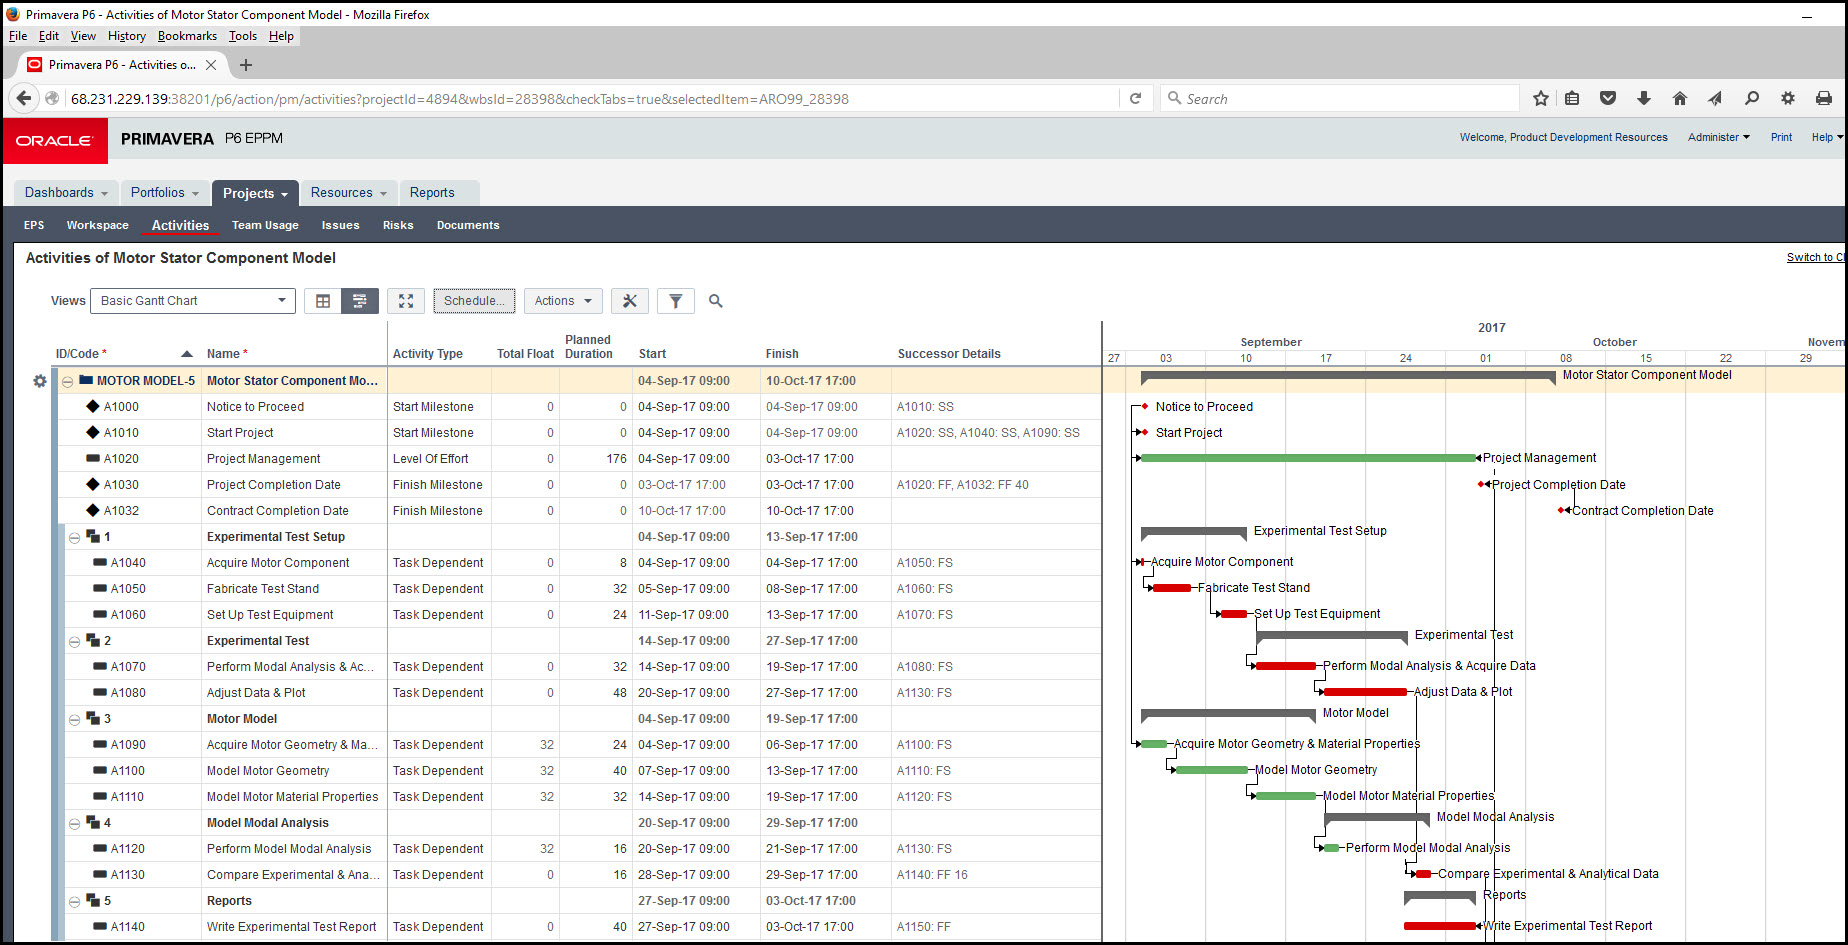
Great! We still have our longest path after our schedule recalculation.
Let’s observe what happens when we progress the schedule one week, Figure 8.
Figure 8
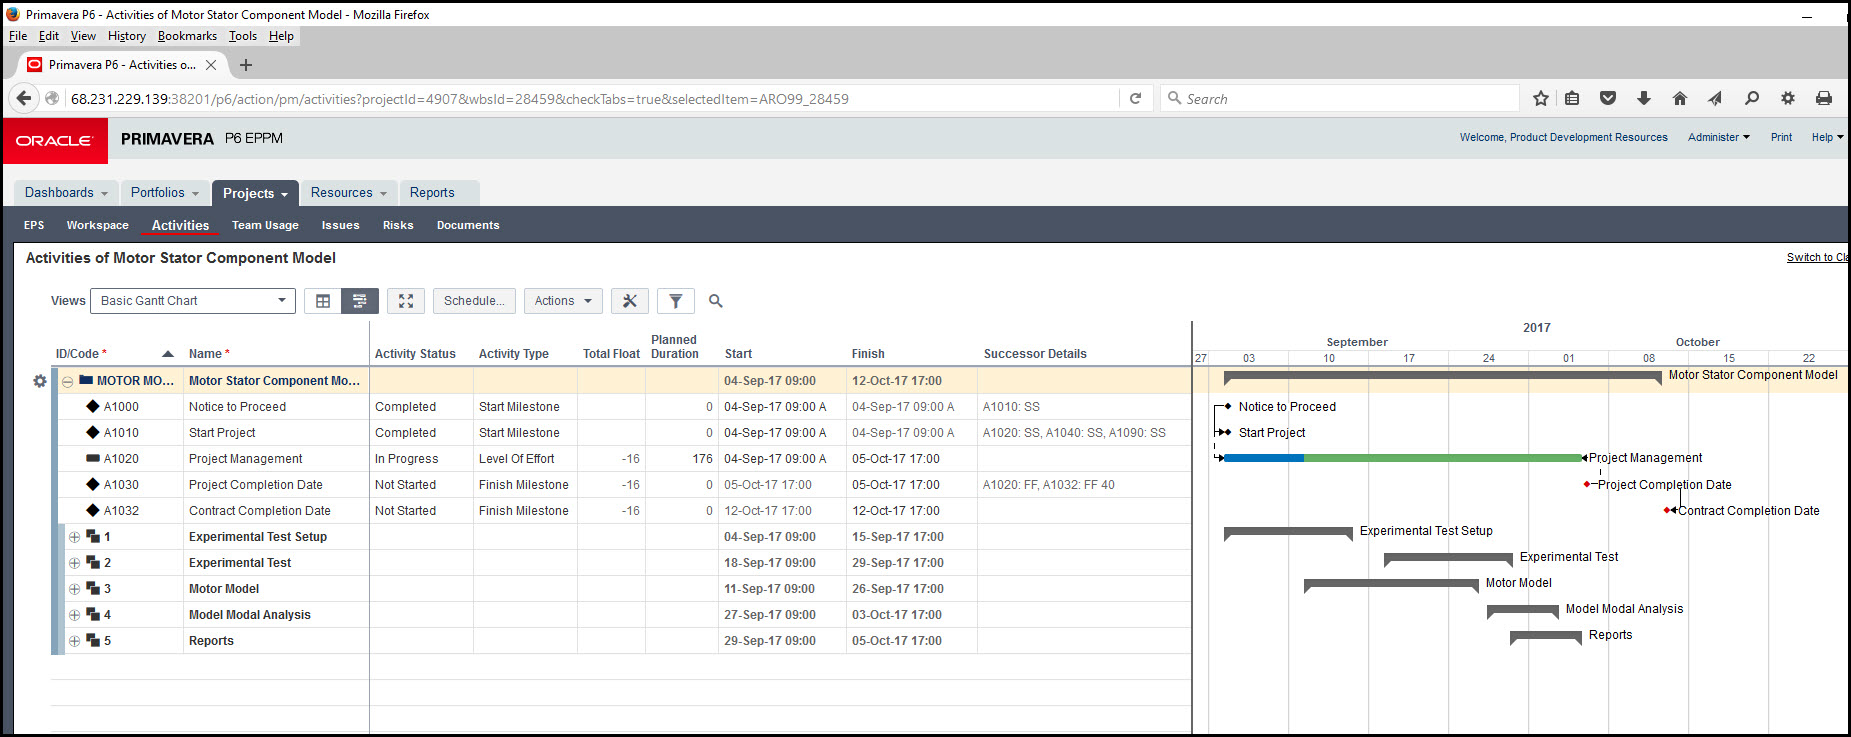
The deadline date shifted right on the Gantt chart, and the total float column is now listing negative 16-hours of float. This is not ideal. What happened? Well, the ‘project completion date’ and ‘contract completion date’ shifted right, but the ‘Finish On’ constraint remained fixed. So in Figure 9 we adjusted the lag from 40-hours to 24-hours, and recalculated the schedule.
Figure 9

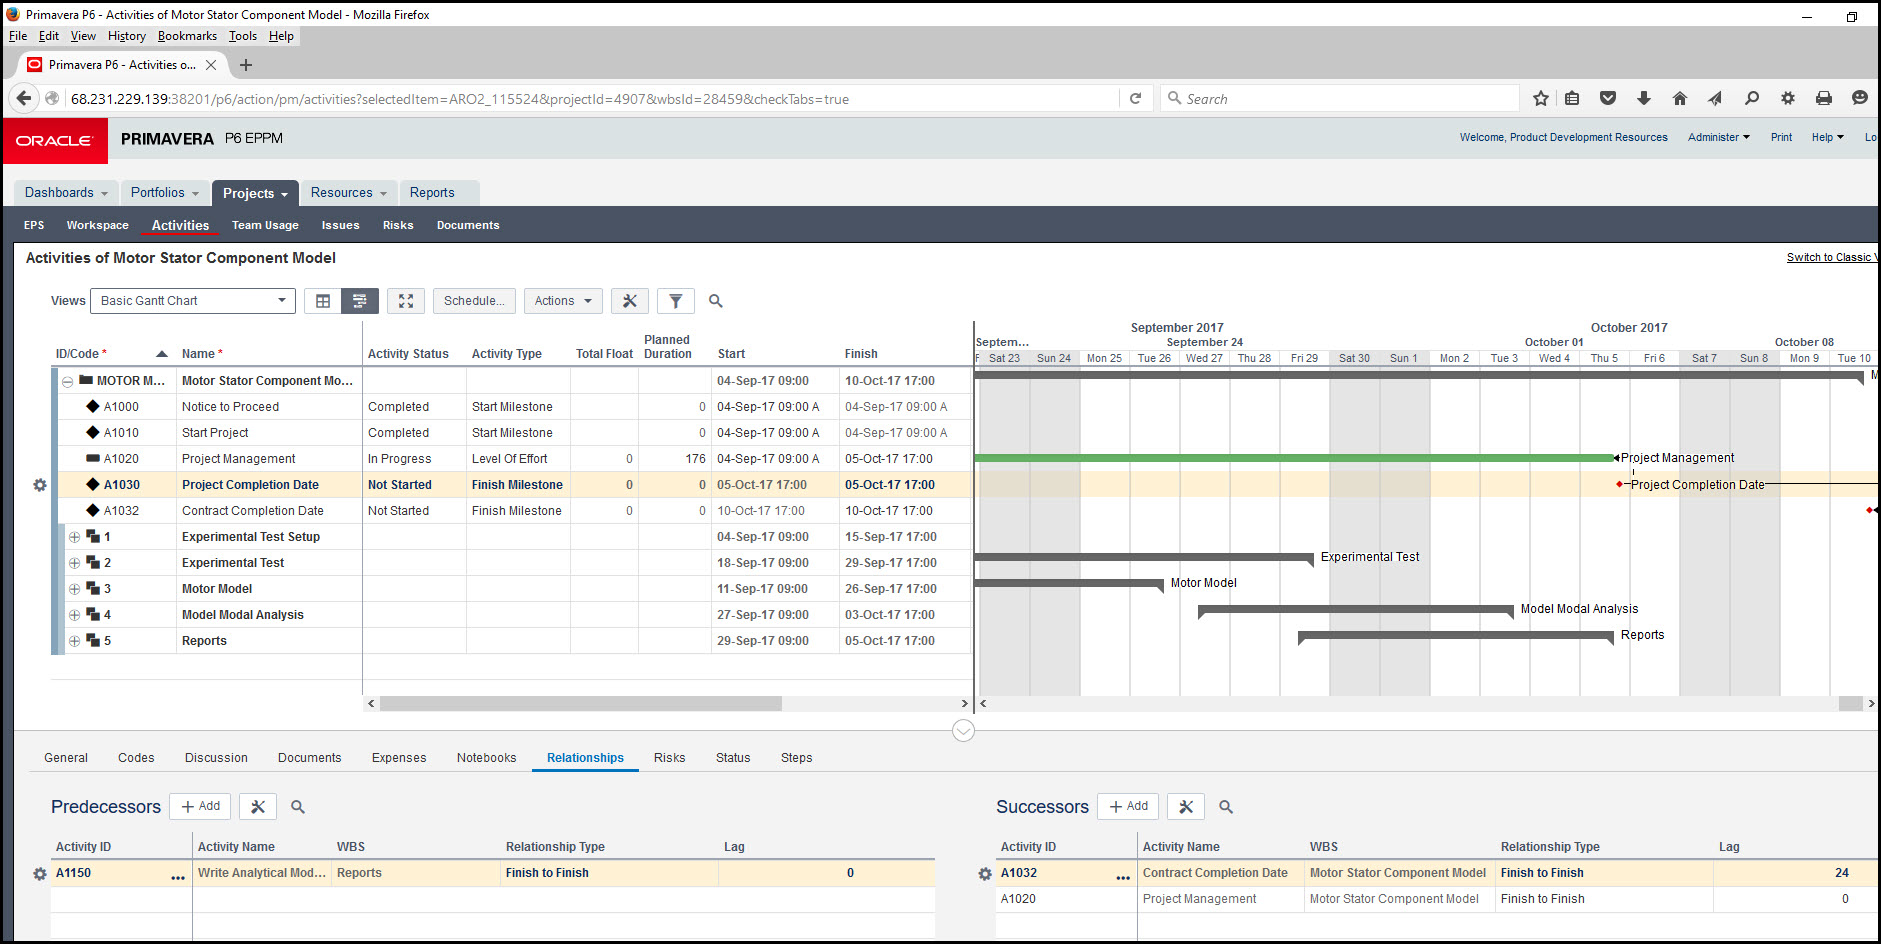
In Figure 10 we simply zoom in to show the 3-day separation between ‘project completion date’ and ‘contract completion date’.
Figure 10
Summary
In Primavera P6 EPPM, it is possible to monitor your schedule deadline in relation to the current projected schedule completion date. In addition to inserting a finish milestone you will need a relationship with appropriate lag. This way you will not lose your longest and/or critical path.
Another thought is to insert a ‘Finish On’ constraint on the ‘project completion date’ finish milestone. This will tell you, even after adjusting the deadline lag, when the schedule is shrinking its buffer or margin between the current ‘project completion date’ and the deadline or ‘contract completion date’. Be forewarned though, that although Primavera P6 EPPM has this capability, some scheduling guidelines may not appreciate this additional constraint.