Deltek Acumen’s file structure is built around three levels of files. Each subsequent level rolls up to the parent level. By maintaining that structure you are able to quickly work with, assess and share data.
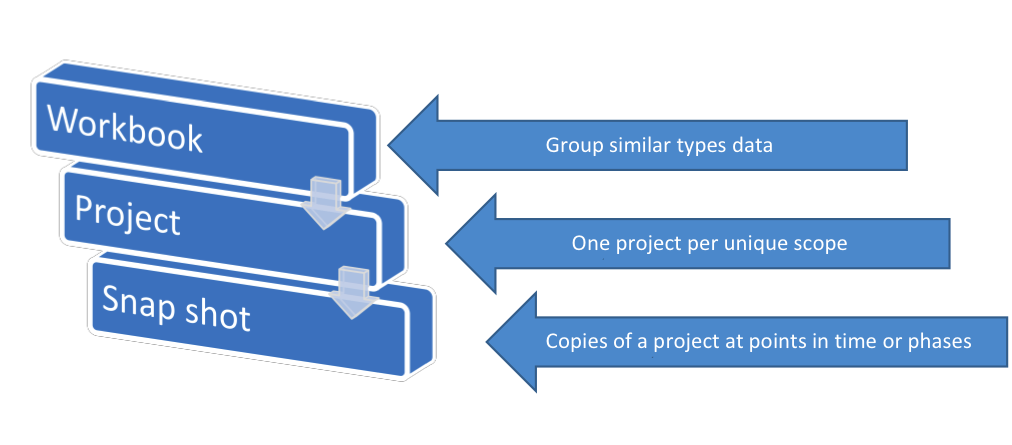
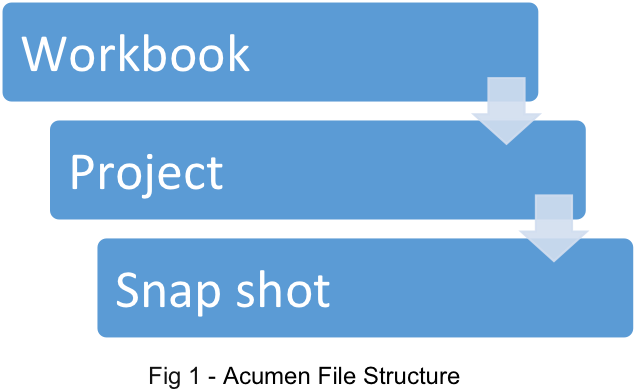 The top level is called the Workbook. This is the heart of Acumen’s data maintenance and works just like a three-ringed workbook might work. Within the workbook there are sections of information, but all are contained within one workbook. For example, you’ll have project information, versions of that project, information about how a project is mapped into Acumen. You also have what metrics are applied, views, etc. Data that is in the workbook, will relate to all of the other types of data that are in the workbook.
The next level down is the Project, or projects. This layer represents a unique project that you want to do analysis on. This is different than a unique version of a project, as we’ll see in a minute. Instead think of this a single scope of work and assumptions that are going to be performed. A workbook can have multiple projects included in it. They may even be the same project with different assumptions to test different scenarios. A single workbook might contain one project or many projects.
The third layer of the file structure is the Snapshot. This is a copy of the project at a point in time. This can be used for tracking versions of the same project where each version represents a statused schedule. Snapshots allow you to quickly identify trends in the project because we can easily compare different snapshots of a project.
Step 1 -Setup up a workbook
The first thing you want to do in Acumen is to set up a workbook. As mentioned above, this is going to be the container for a lot of information that Acumen will use. Typically you are going to define a workbook by either a project, or type of project in which you will be able to share data across project types and that you might want to do a comparison between. For example, if your organization does different types of projects, say building hospitals and building schools, you can set up a workbook for each type of project. This allows you to easily compare hospital projects since they will all be in the same workbook. At the same time, you are not comparing different types of projects that are not as easily related like schools and hospitals.
Step 2 – Pull in a project(s)
Once the workbook is there you can start pulling in projects to perform analysis on. Acumen gives you lots of options to do this. In the top right section of the ribbon you see the “Get External Data” section. You can pull in Microsoft Project, Primavera, Open Plan, Excel files, even UNCEFACT files.
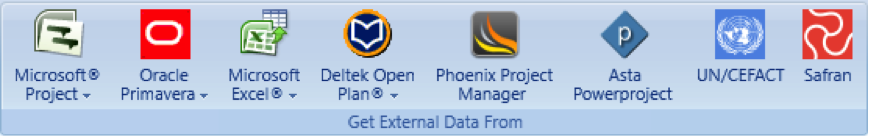
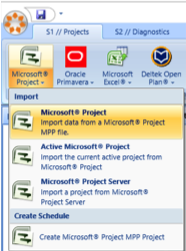 If you click on the icon an Open File dialog will open targeted at the default file format for each product. You can also click the arrow at the end of the name and you will get a list of different file formats for that product that you can import. For example, with Microsoft Project you can pull in an .mpp file, the active project with MS Project open or even connect to Microsoft Project Server to pull in data.
Once you’ve selected the file format, simply use the open file dialog to navigate to where the file is and open it (with server versions you’ll use the URL to connect to the database). This step essentially creates a pointer to the file so that it can be imported, however the file is not quite in Acumen yet.
Step 3 – Import the File
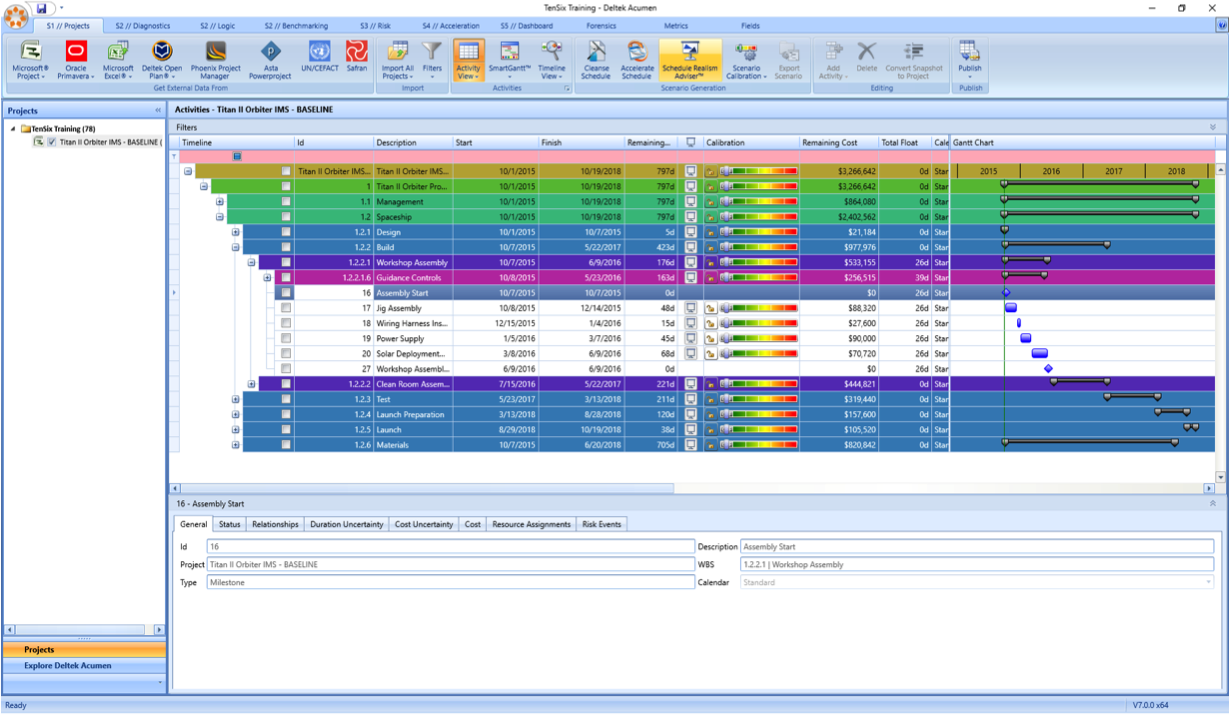
Once you have a project in the workbook, you can import the data into Acumen. Simply click on the project and then click on “Import” to pull the data into Acumen.
 Acumen will pull in the data from the source file you pointed to. If you have multiple projects in your workbook, you can import all (or a selection of the projects) into Acumen at the same time by using the check box next to the project name and selecting “Import All”. Once the import is complete you’ll see your complete project in the Acumen project view.
 If you want to do trend analysis, for example for month over month comparisons, you will want to pull in a snapshot of the project. It is important that you use the snap shot functionality for this instead of simply pulling in a copy of the file into a new project in Acumen. Remember that Acumen has a three-tiered structure that it uses for trend analysis and that third tier is the snapshot.
Step 4 – Pull in a snapshot
 To pull in a snapshot of a project you simply right click on the project in the left window of Acumen and select “New Snapshot” from the popup menu. From that menu you can select the file type similar to what you did when adding a project to the workbook. Like adding the project, for Microsoft Project you can select the file type you want to import. When you select the file type the “Open File” dialog opens up and you can use that to navigate to the location of your file and select it. Now you’ll have a project and at least one snap shot for the project showing in a hierarchical structure.
You can use the same dialog to select multiple snapshots of the project and import them in at the same time. If you use the “Import All” option at this point you will pull in all the versions of the project you selected.
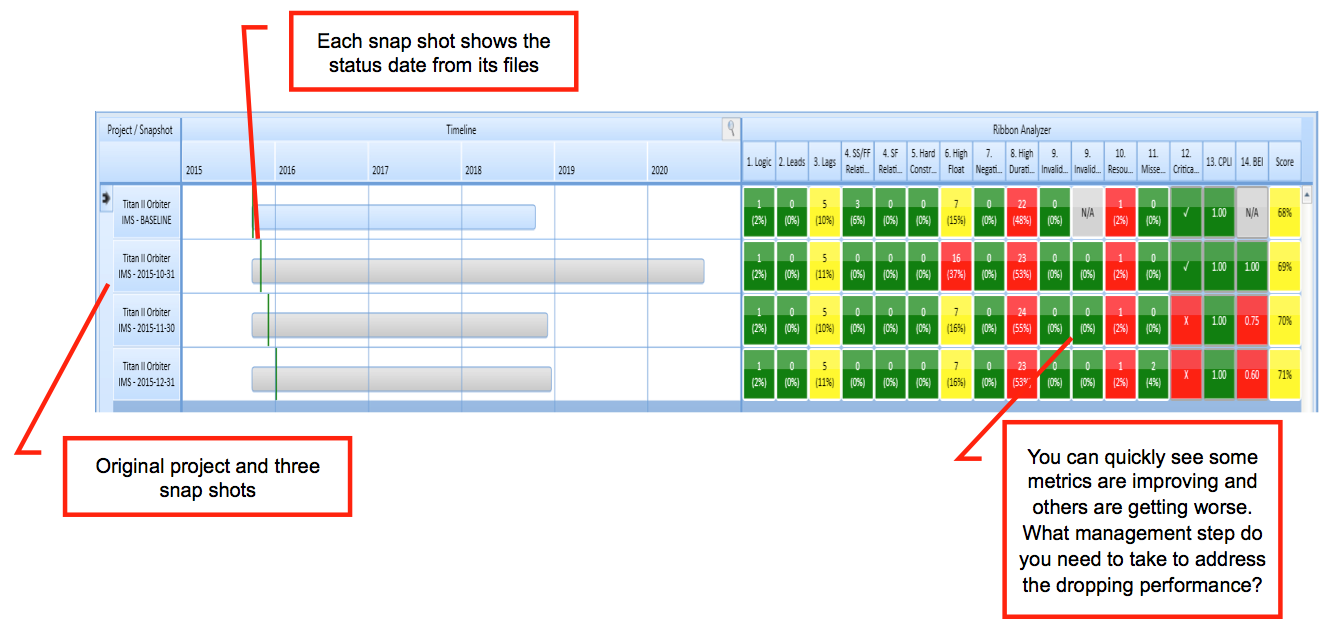
With the complete data tree filled out in Acumen, starting with your workbook, then project and finally snapshots, you can take full advantage of the analysis capabilities of the tool. This will allow you to see not only the quality of your schedule at a single point in time, but trend analysis across multiple status cycles. You can see how the changes you made to either your processes or schedules are trending in your project.
 Remember the three levels of the data model for Acumen and what type of data goes into each to take full advantage of the tool.