If you are asked to develop a schedule in the early stages of the project life cycle it’s likely the project may not even yet have a specified start date and deadline. Displaying calendar dates on the Microsoft Project Gantt chart in these situations may cause confusion. Let’s explore an alternative Gantt chart labeling approach in Microsoft Project.
More often than not you are provided start and end date constraints for the schedule you are creating. In the rare occasion when you must present a schedule to stakeholders without anchored start and end dates your schedule presentation may cause confusion if your Gantt chart displays standard calendar time. In these situations it is more appropriate to make the start date zero and following dates part of a series: 1, 2, 3… The series may defined as days, weeks, or months. And this Gantt chart labeling series is referred to as ordinal date labeling. Microsoft Project provides ordinal Gantt chart labels, in lieu of not having a project start date.
This article shows how to make a Microsoft Project 2013 Gantt chart presentation using calendar ordinal dates. It is beyond the scope of this blog to demonstrate displaying calendar ordinal date start and finish columns in the task table.
Let’s begin with our demonstration project, Figure 1.
 Figure 1
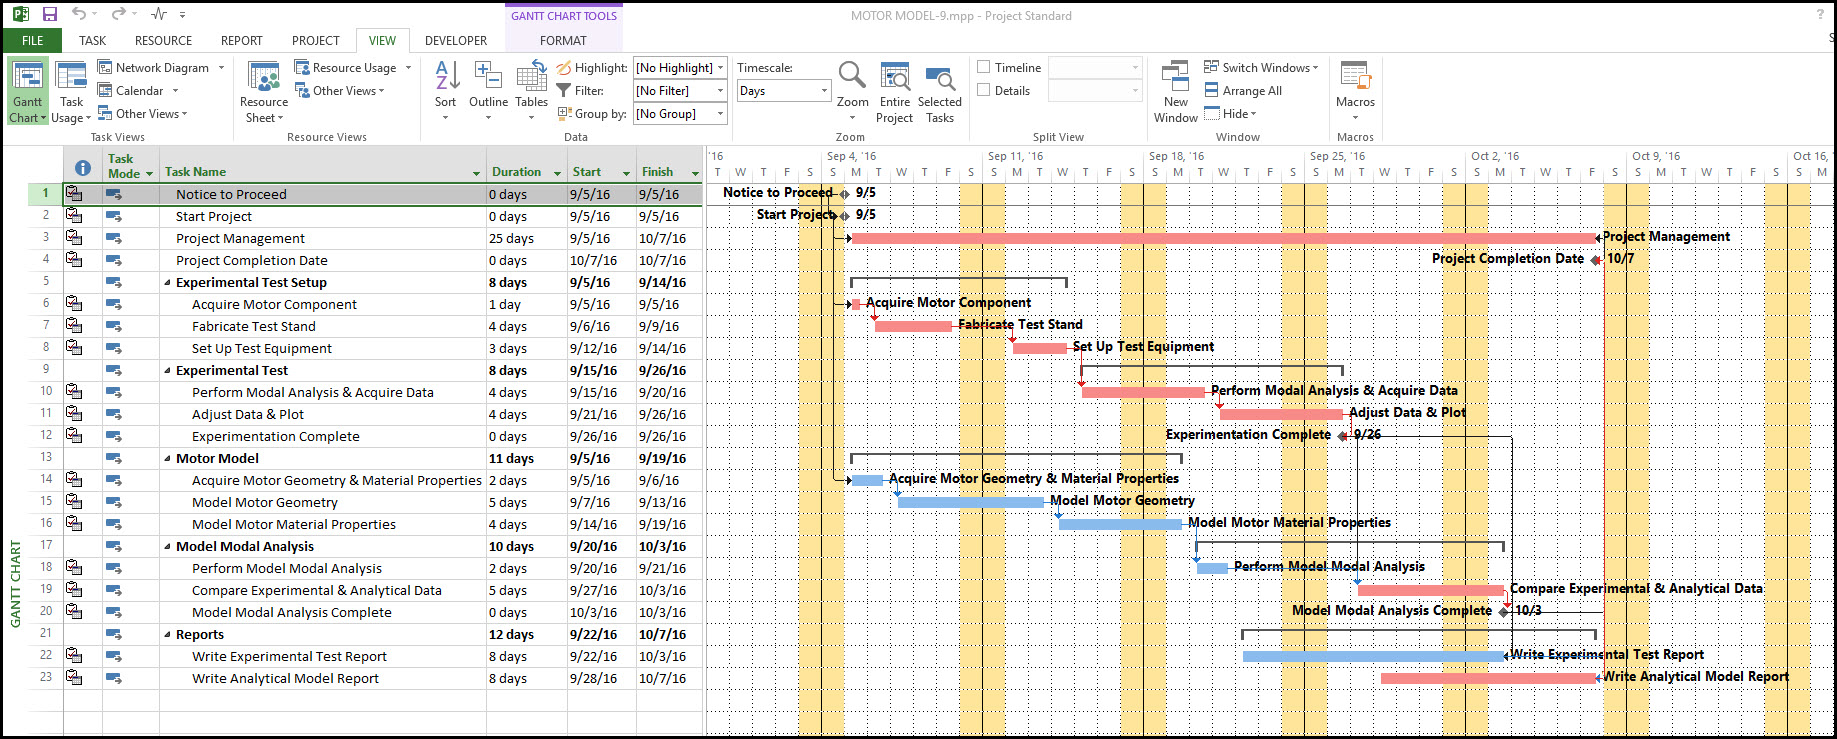
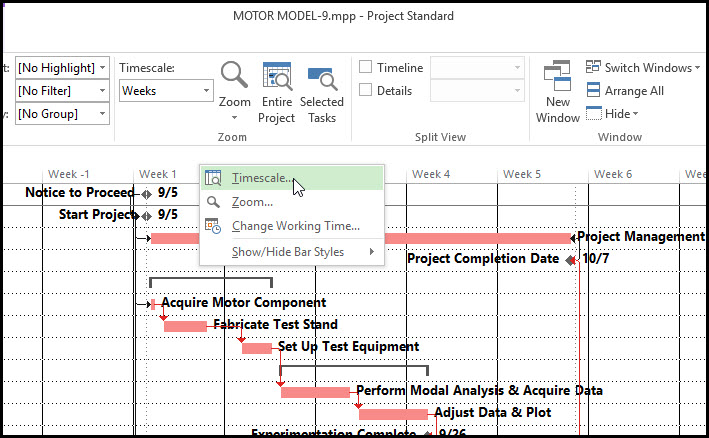
This schedule has a start date of 05-Sept-2016. This short schedule extends through September on into October. However, you are told that the start and finish dates are still in negotiation, and so stakeholders want you to present the Gantt chart labeling, accordingly, without calendar dates. We proceed by investigating our options. Right click anywhere on the timescale and select Timescale from the popup menu, Figure 2.
Figure 2
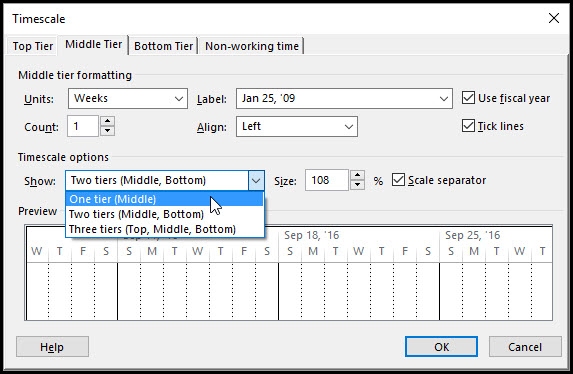
Choose to display only one tier on the timescale, Figure 3.
Figure 3
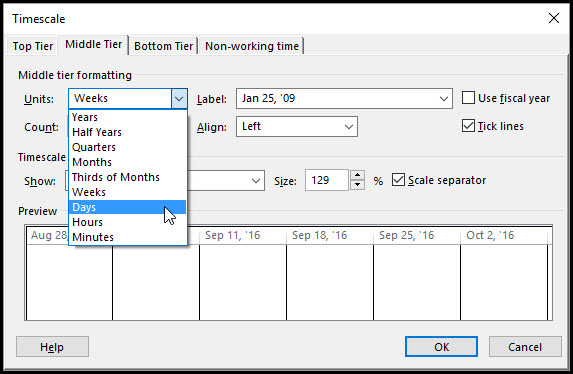
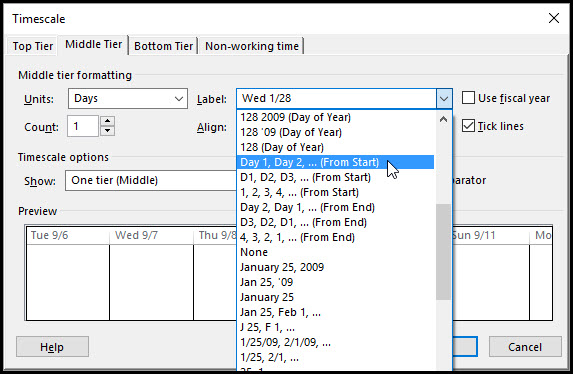
Also, it’s a short project so let’s select Days as the Units, Figure 4.
Figure 4
Select “Day 1, Day 2, … (From Start) for the label, again, make sure it’s (From Start), Figure 5.
Figure 5
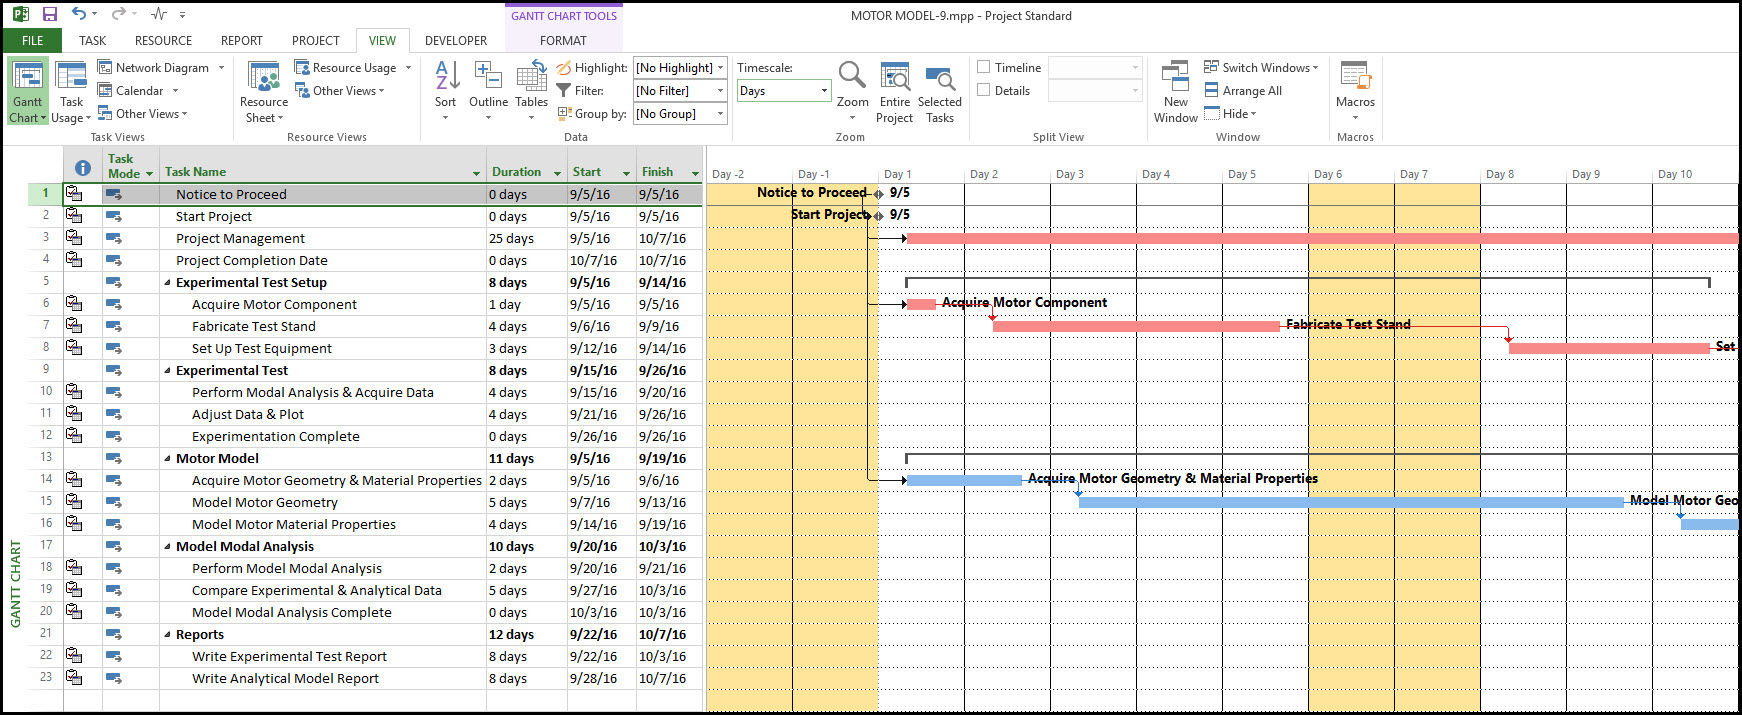
The resulting Gantt chart with calendar ordinal dates is displayed in Figure 6.
Note that the start of the project is at zero on Day 1, Figure 6.
Figure 6
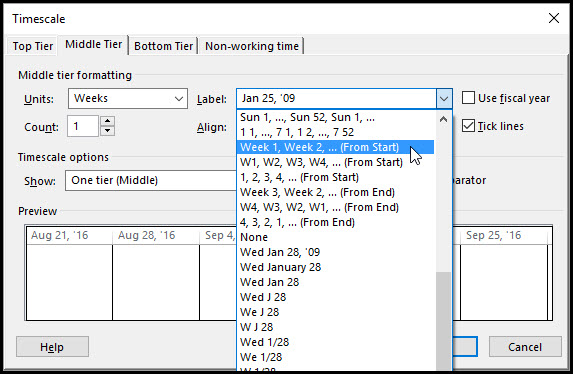
This looks fine, but we want to view the entire schedule in our Gantt chart presentation. It is preferable therefore to display our ordinal series in weeks instead of days. In Figure 7 we therefore set the Units in the Timescale dialog to Weeks and the Label to “Week 1, Week 2, …(From Start).
Figure 7
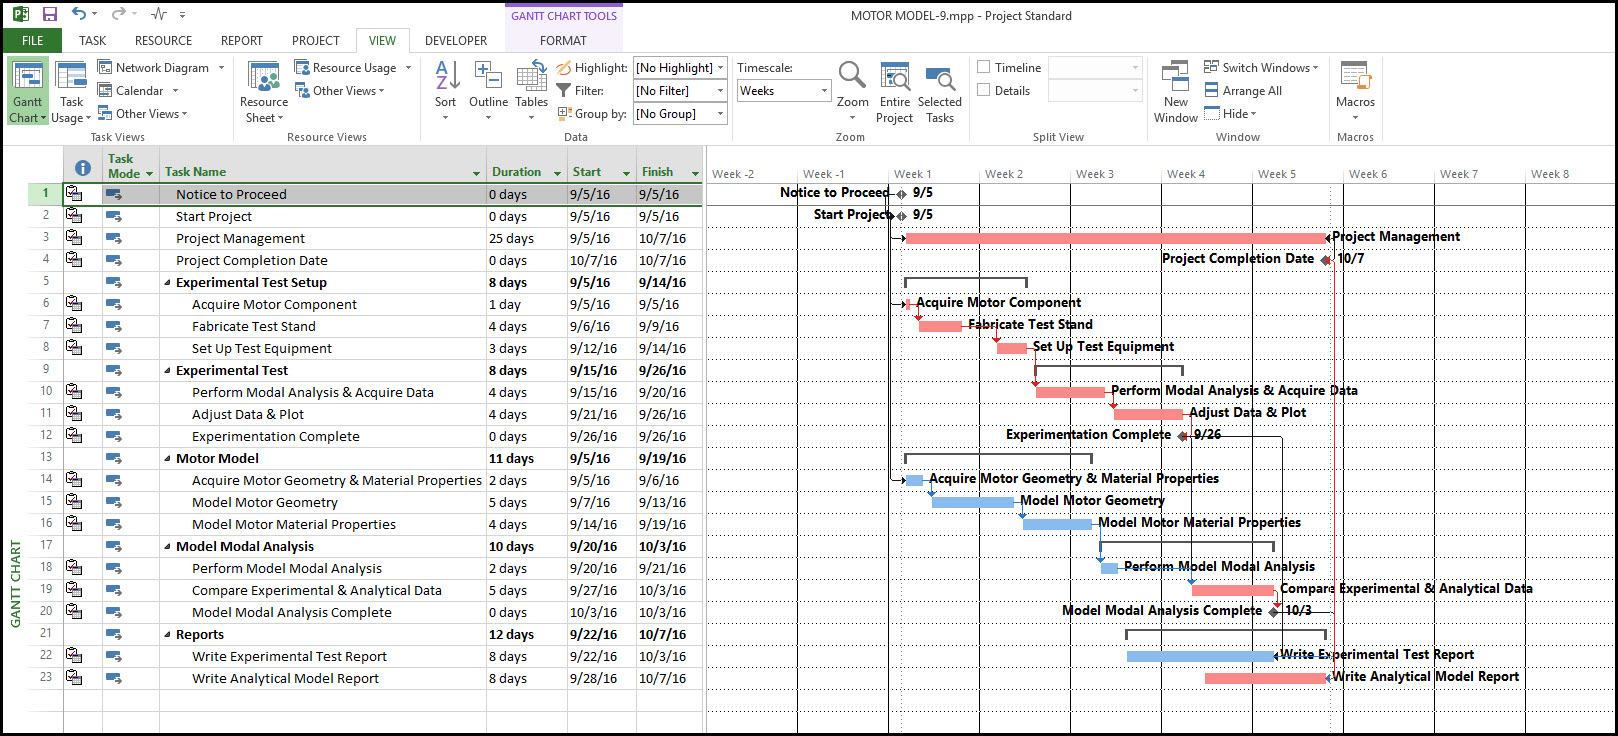
The complete schedule is displayed in Figure 8 with calendar ordinal weeks.
Figure 8
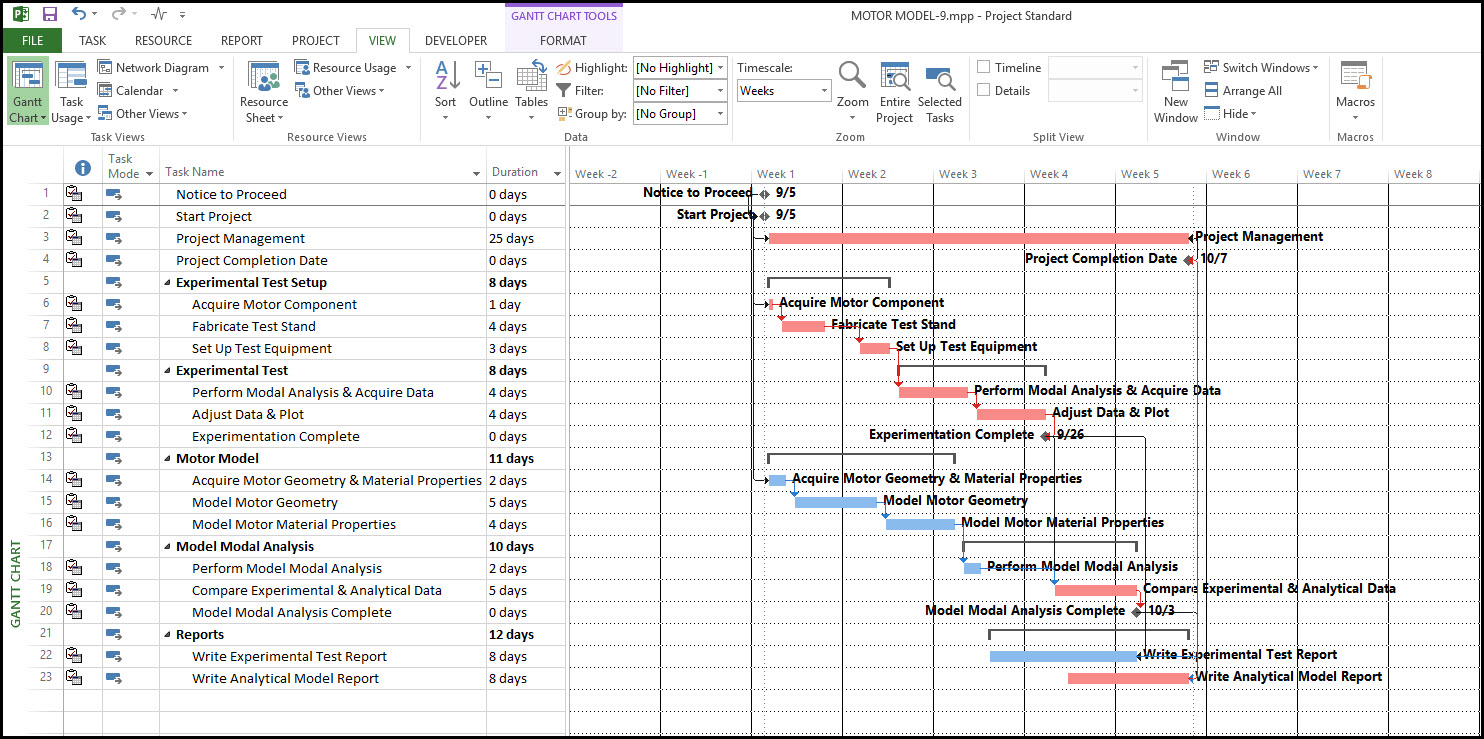
The last step before presenting the schedule to stakeholders is to remove the calendar start and finish columns from the task table. This again is to avoid confusing stakeholders that have not yet committed to a project start date. The final schedule presentation is displayed in Figure 9.
Figure 9
Summary
Projects in the planning stage may not have a consensus or agreed upon start date or deadline. Presentation of Microsoft Project schedules in these situations call for ordinal calendar date labeling on the Gantt chart. Additionally, you may need to remove calendar start and finish task columns from the task table. All this is done to avoid confusion when a project is not yet anchored by a start date.
It is also possible in Microsoft Project to display calendar ordinal start and finish days or weeks in the task table. Note our distinction ‘calendar’ ordinal dates. We insert the term ‘calendar’ to specify that our ordinal dates include weekends in their computation. Again, how to display calendar ordinal start and finish dates on the activities table is a blog topic for another day.