Your quality assurance inspection can take place over a specified ideal date range. Here we look at how to display this prime period date range window of opportunity along with the forecasted inspection date on the Gantt chart.
Scenario
Your project’s government Contracting Officer (CO) plans to be onsite the last week in September. You want to schedule your pipe repair project so that the final quality assurance inspection falls within this date range or window when the CO will be on campus.
You also want to display this inspection window of opportunity on the Gantt chart along with the forecasted final quality assurance inspection date. It is possible to display an acceptable date range bar on the Gantt chart along with a forecasted inspection date milestone.
This article demonstrates how to display a prime period date range bar coupled with a milestone on the Gantt chart.
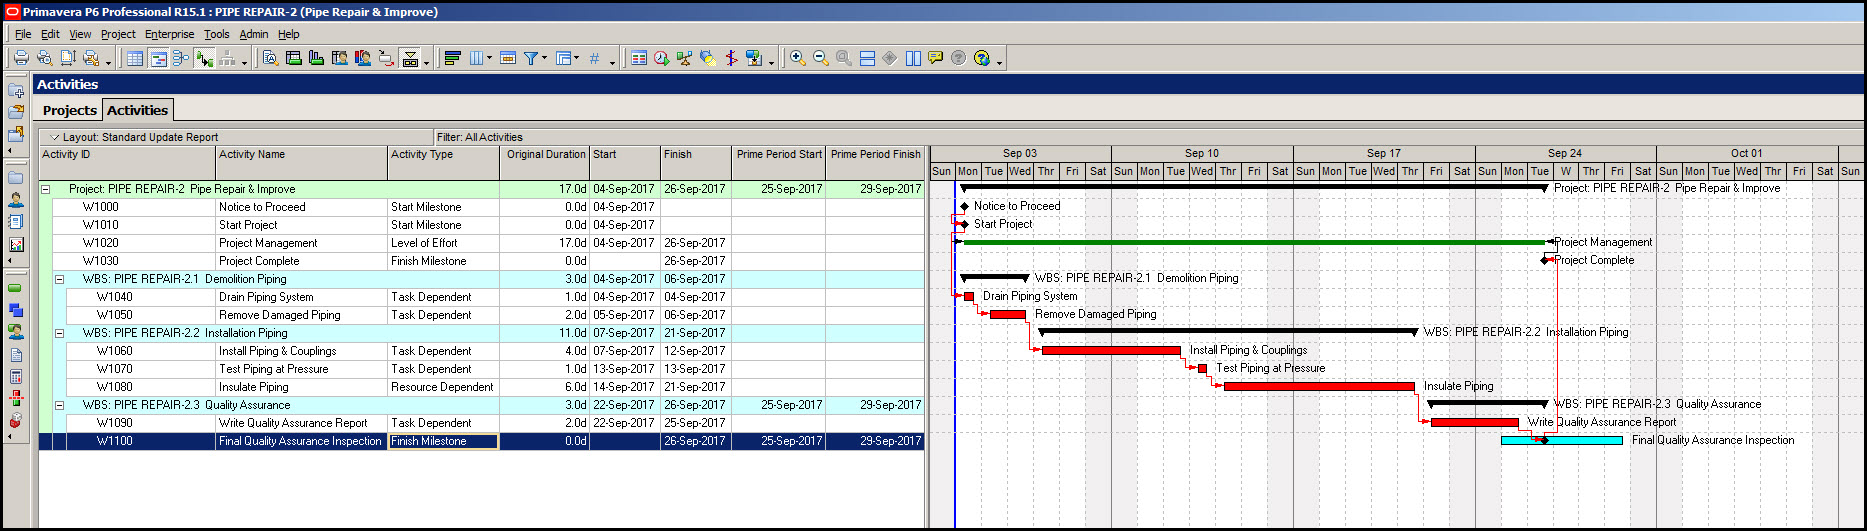
Our demonstration project is in Figure 1.
 Figure 1
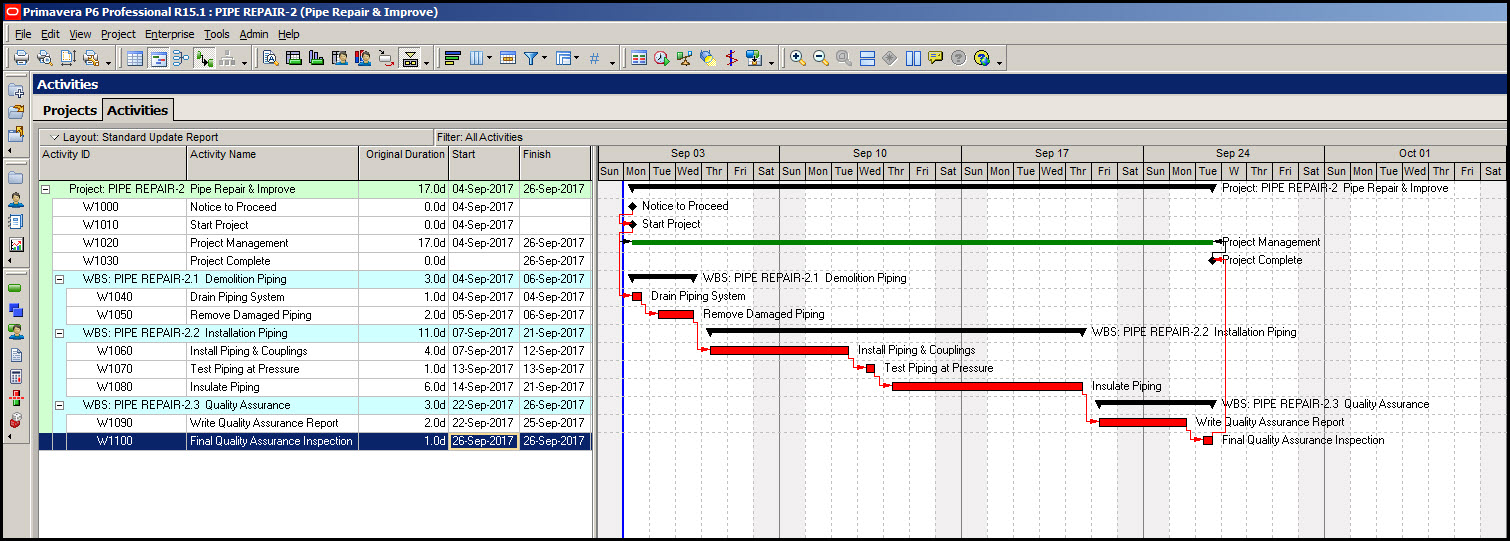
This is a piping repair project that has three work breakdown structure (WBS) elements, i.e. deliverables: demolition piping, installation piping, and quality assurance. The schedule situation is similar to that described above. The CO plans to be on the construction site during a one week time period. And we want our final quality assurance inspection to coincide with the CO’s onsite visit. What we want to achieve here today is a Gantt chart bar displaying an inspection prime period date range coupled with a forecasted inspection milestone date. The finish milestone is tied to the schedule logic; the prime period bar is not.
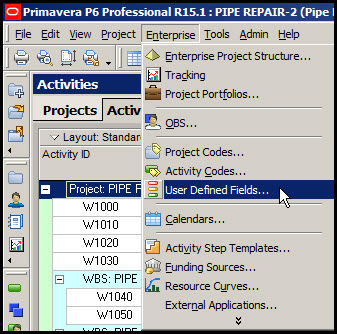
We begin by creating user defined fields (UDF) for our prime period dates. Select enterprise | user defined fields, Figure 2.
Figure 2
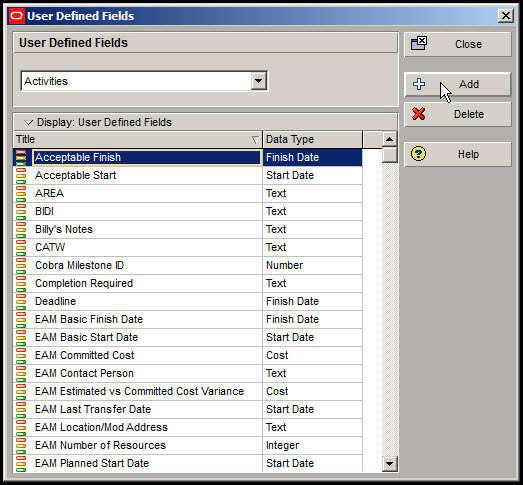
Set the UDF dialogue to activities and click + add, Figure 3.
Figure 3
Enter ‘prime period start’ title and ‘start date’ data type, Figure 4.
Figure 4

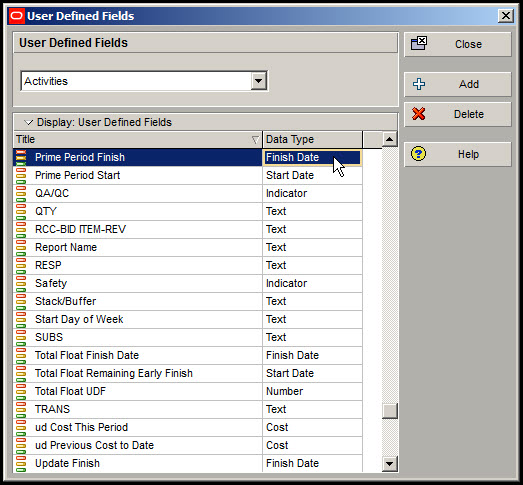
And do the same to enter a ‘prime period finish’ UDF, Figure 5, except the data type is ‘finish date’.
Figure 5
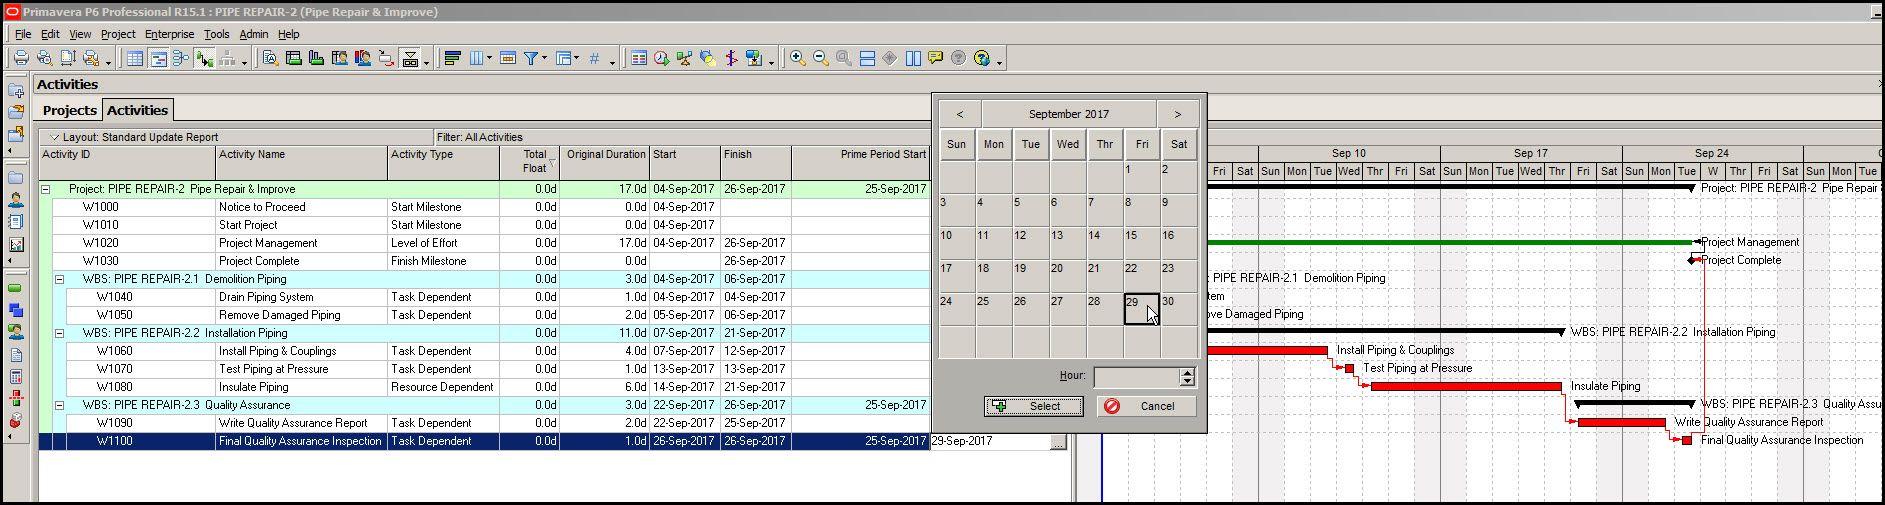
In Figure 6 we add ‘prime period start’ and ‘prime period finish’ columns to our activity table, and assign the desired date range to the ‘final quality assurance inspection’ activity.
Figure 6
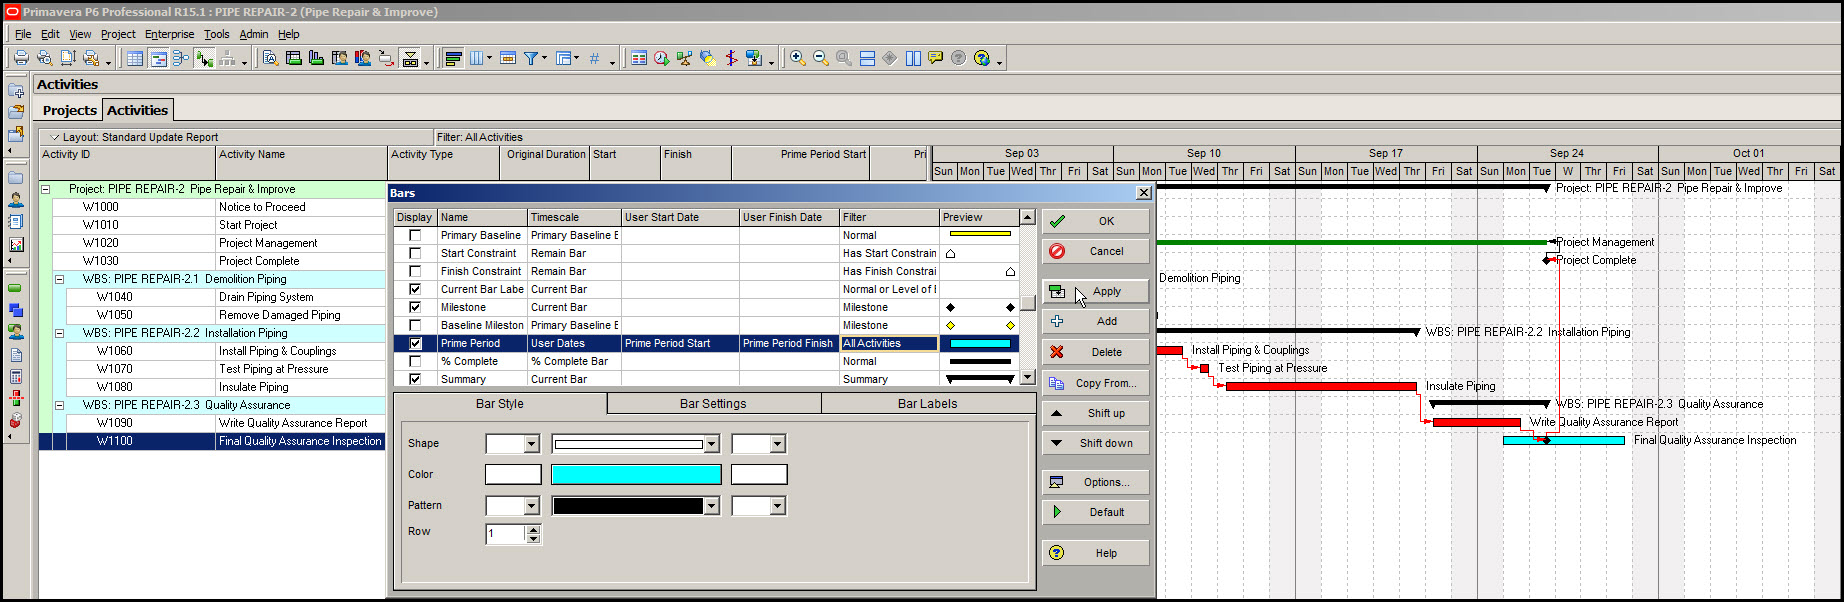
Next we define our prime period Gantt chart bar, Figure 7.
Figure 7
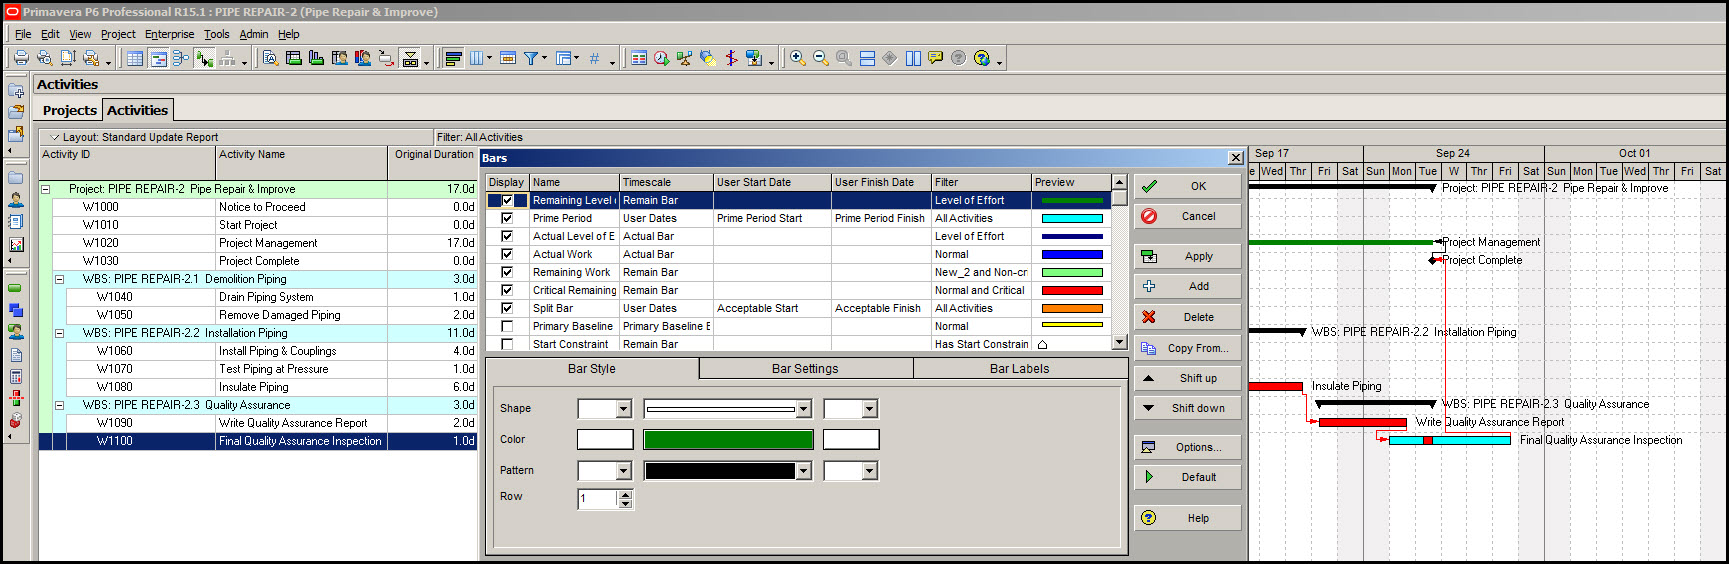
The bar name is prime period. Select user dates for the timescale and enter the appropriate user start date and user finish date. ‘All activities’ for the filter is good. Last, we choose light blue for our prime period bar color. Hit apply and the prime period bar displays as in Figure 7.
There is something not quite right with our Gantt chart though. This is our “where’s Waldo” question of the day: can you find the flaw in the Gantt chart? Well, the answer to the riddle is that the relation/logic lines connect to our ‘prime period’ bar and not the ‘final quality assurance inspection’ bar.
The culprit for this miscue has to do with the bars dialogue and, in particular, where on the stack or list of bars our ‘prime period’ bar appears. We know that the bars placement in the stack is important from the bars dialog up/down arrows, which are our clue. Let’s move the ‘prime period’ bar lower in the stack to investigate how this affects our Gantt chart. In Figure 8, our ‘user dates’ definition is shifted below all other Gantt chart bar definitions.
Figure 8
The result of this is that our activity logic lines now connect to the ‘final quality assurance inspection’ activity. Unfortunately, though, the ‘final quality assurance inspection’ bar no longer appears on the Gantt chart. It is in fact hidden by the ‘prime period’ bar. Not good!
Lets’ see what happens, however, when we change the ‘final quality assurance inspection’ from a task dependent to a finish milestone activity, Figure 9.
Figure 9
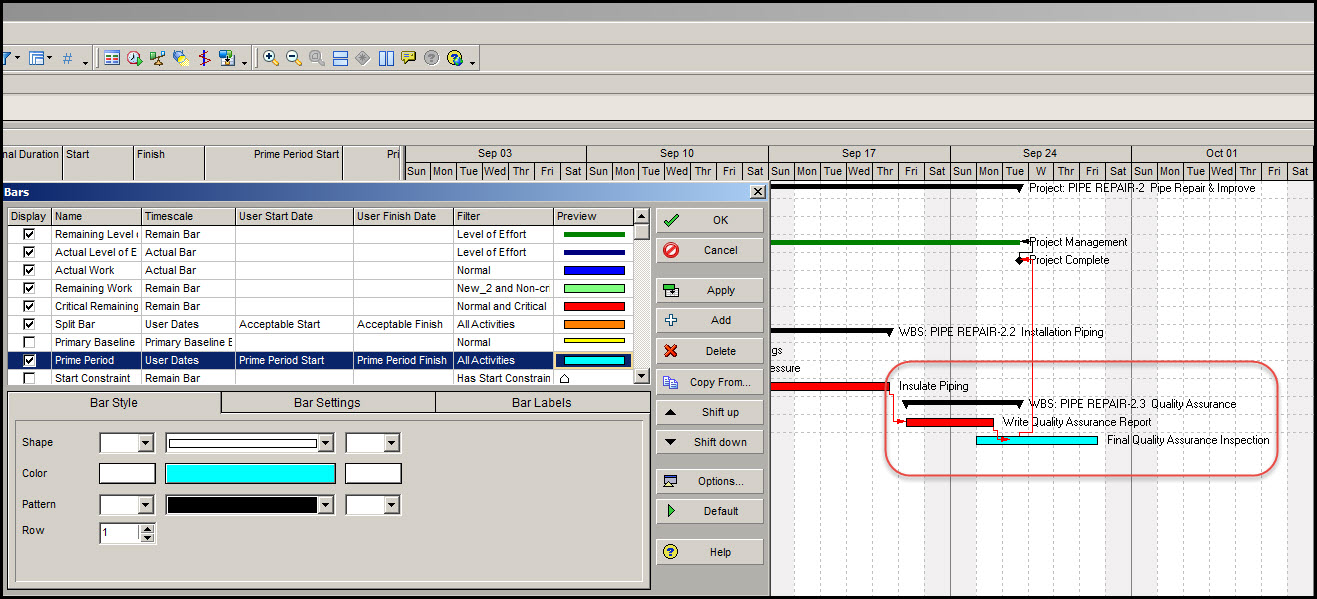
The finish milestone appears over laid on top of our ‘prime period’ bar as desired, but the relationship lines are now not correct. To fix the relationship lines we shift the ‘prime period’ user dates bar below the milestone bar definitions, Figure 10.
Figure 10
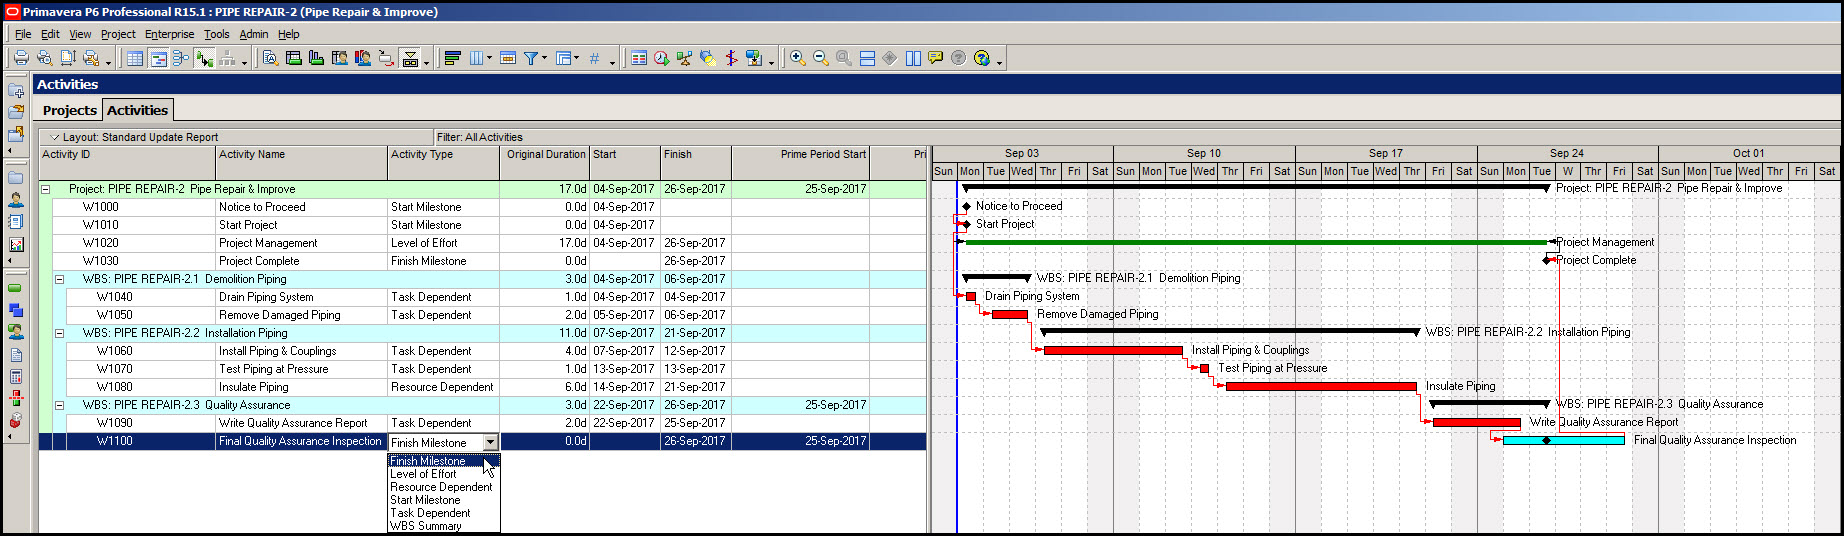
Great! That solved our problem. The milestone still appears on the Gantt chart and the relationship/logic lines correctly connect to the finish milestone. The final schedule is as displayed in Figure 11.
Figure 11
Summary
The Gantt chart is at the heart of Primavera P6 Professional scheduling software. And the Gantt chart provides insight into your project schedule in a way that only a graphic pictorial can achieve.
Yes, the user dates bar definition settings serve a purpose for the Gantt chart; they allow you to define a ‘prime period’ or similar bar date range. And when coupled with a milestone they support displaying where a forecasted, e.g. finish, milestone falls along your window of opportunity, your ‘prime period’ date range.
So you have on your Gantt chart a dynamic logic driven milestone overlaid on top of a static user defined acceptable period date range. This is yet another way Primavera P6 supports the effort to predict and adjust the schedule, accordingly, to coordinate important dates in the life of the project.