At the heart of most scheduling software is the Gantt chart. But using the Primavera P6 trace logic feature is useful if you are interested in better understanding the relationships between activities.
Trace Logic is a tool in Primavera P6 Professional that enables you to step through or “trace” through schedule activities in order to focus in on activity predecessor and successor relationships. The Trace Logic tool displays relationships for any activity you select in the Activity Table or Gantt chart. It also works or displays relationships for any activity selected on the Activity Network. Trace Logic allows you to dive into the schedule to better understand an activity’s placement in the schedule.
This article introduces the Trace Logic feature in Primavera P6 Professional as a tool for better understanding respective activity relationships.
We begin with our demonstration project shown here in Figure 1.
 Figure 1

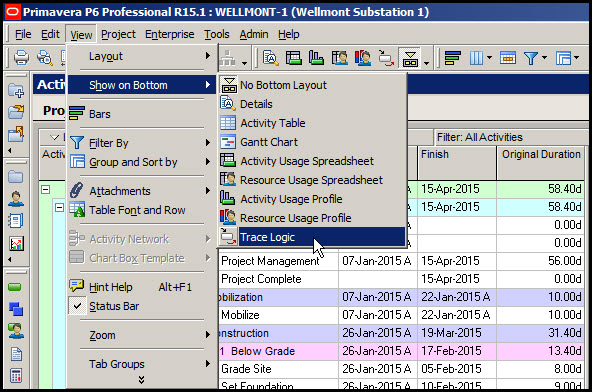
This schedule has been progressed one month, January. The blue bars on the Gantt chart are completed work, green non-critical future work, and red critical future work. To display the trace logic select View | Show on bottom > Trace Logic, Figure 2.
Figure 2
Highlight the respective activity in the Activity Table or Gantt chart and view its trace logic in the bottom pane. In Figure 3 we display the trace logic of the Grade Site activity.
Figure 3
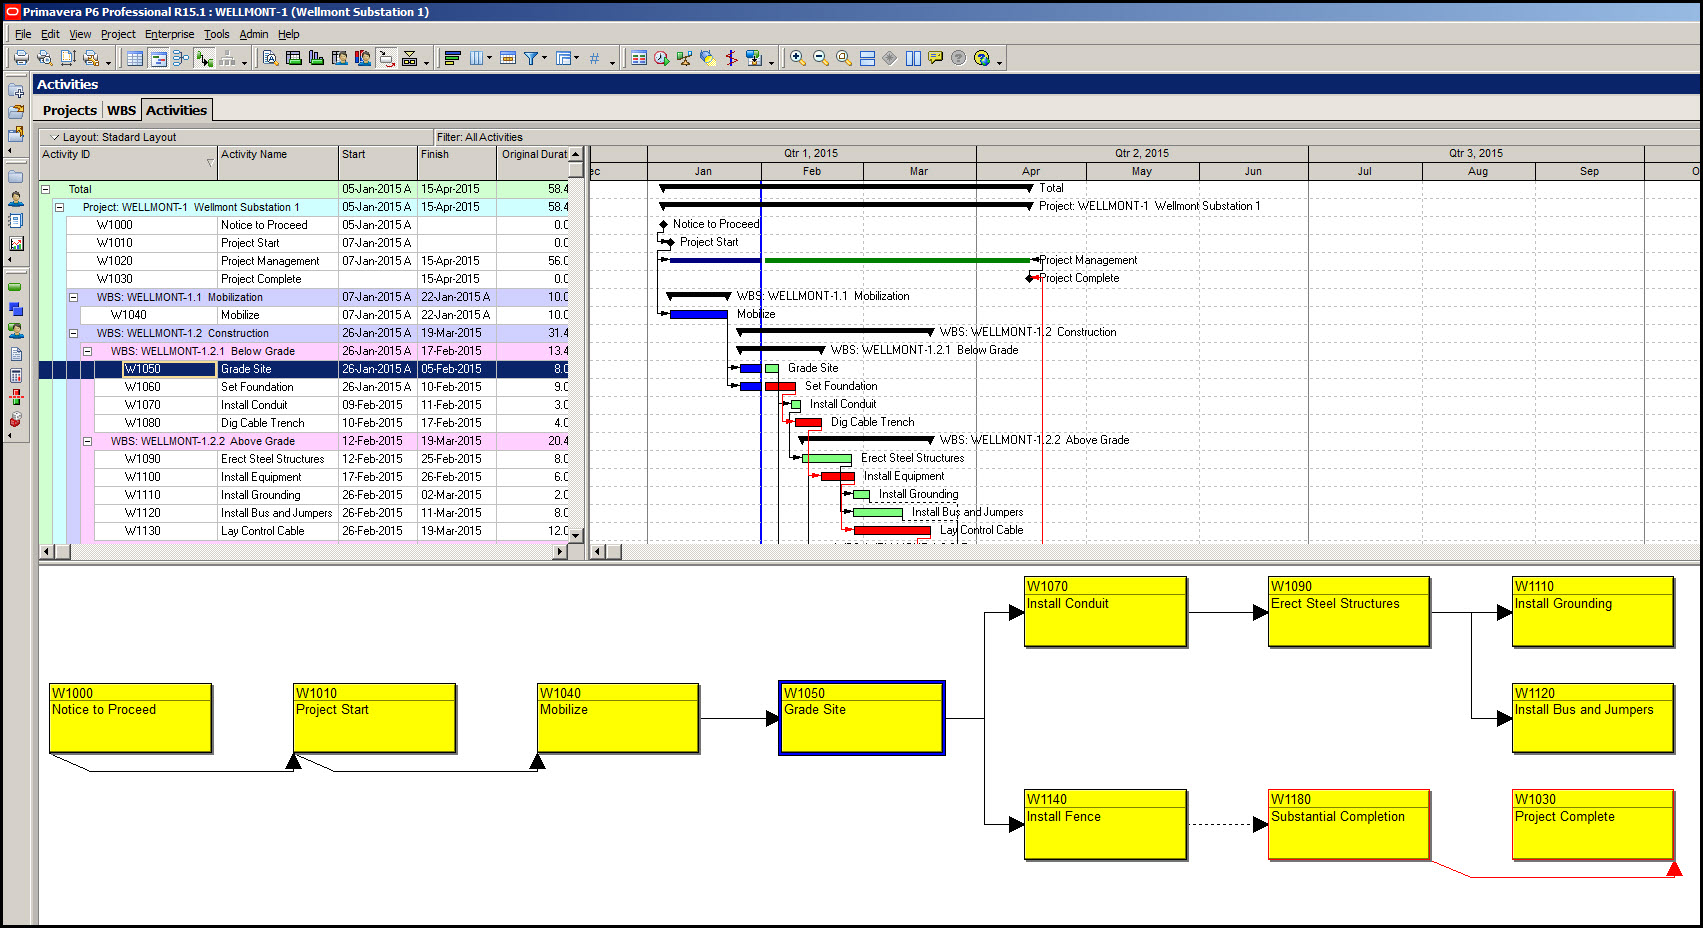
Note that Grade Site’s predecessors form a sequential path while its successors form two parallel paths.
To better understand and interpret the trace logic consider the following trace logic chart features:
- Activity boxes outlined in red are critical activities, while activities outlined in black are non-critical.
- Solid red lines denote critical relationships, and solid black lines are non-critical.
- Dashed lines represent non-driving relationships, whereas solid lines specify driving relationships.
Note for a rudimentary introduction to driving relationships refer to the blog “Driving and Free Float Activity Properties in Primavera P6”.
Supplied with the above trace logic understanding we see that Grade Site’s predecessors are non-critical and its successors are non-critical. Further, if we proceed down the successor ‘Install Fence’ path we see the dashed arrow between ‘Install Fence’ and ‘Substantial Completion’ signaling that this activity connector relationship is non-driving.
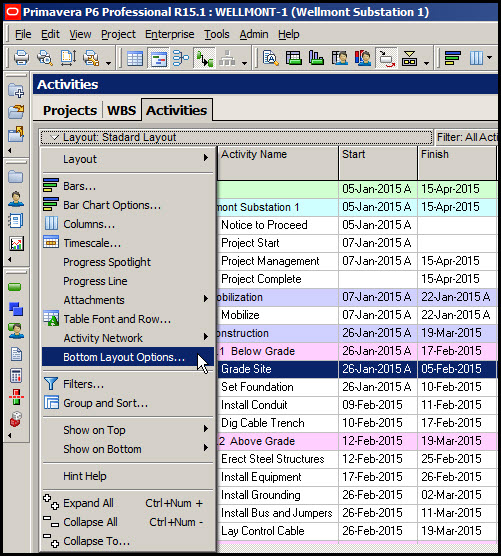
You may limit the number of predecessors and successors viewed on the Trace Logic chart by selecting the Layout drop down menu and Bottom Layout Options, Figure 4.
Figure 4
The resulting dialog is displayed in Figure 5.
Figure 5
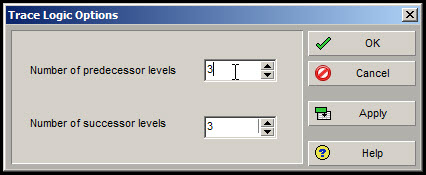
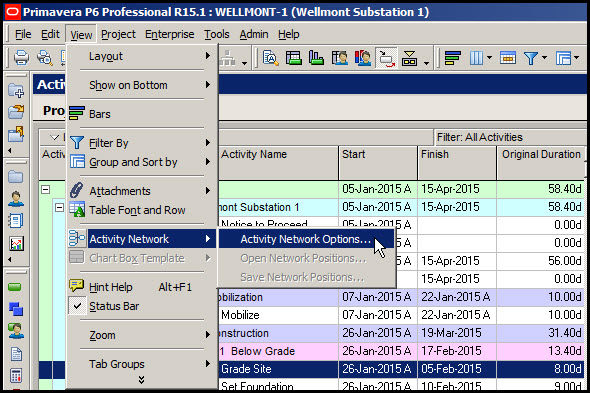
Change the number of predecessors or successors accordingly. You may also define the contents of the activity boxes by selecting View | Activity Network > Activity Network Options, Figure 6.
Figure 6
This pops up the Activity Network Options dialog, Figure 7.
Figure 7

For more details on controlling the contents of the activity boxes refer to the companion “The Primavera P6 Professional Network Diagram” blog.
To print the trace logic along with the Activities Table and Gantt chart toggle on the Trace Logic in the Print Page Setup dialog Options tab, Figure 8.
Figure 8

Summary
Trace Logic is a Primavera P6 Professional feature that allows you to focus in on an activity’s predecessors and/or successors. Familiarizing yourself with the Trace Logic features will better help you to spot critical activities, critical relationships, and driving and non-driving relationships.
You may also print the trace logic of an activity below the Activity Table and Gant chart. Trace Logic is definitely a tool you want in your arsenal to help you better understand and diagnose issues with your schedule.