The Work Breakdown Structure (WBS), in a nutshell, is a hierarchical decomposition of project deliverables. Primavera P6 has a WBS Gantt chart view that provides the standard interface for defining and editing WBS elements. But did you know that Primavera P6 Professional also has a WBS Chart view that is more suited to displaying and/or reporting the WBS hierarchical structure?
How you display the WBS is important for understanding and communicating project scope. As mentioned, Primavera P6 has a WBS Gantt chart or outline view that provides a helpful interface for WBS creation and modification. This WBS outline view correlates nicely with the schedule activity table.
However, if you are only interested in viewing the WBS by itself and do not necessarily need to view it in a format compatible with the activities table view then you can use the hierarchical diagram, i.e. chart view. The WBS hierarchical diagram or chart view provides the best depiction of how each individual WBS element fits into the big picture. The saying is true; a picture is worth a thousand words. Projects can have many pieces, and it is important to understand how each puzzle piece fits in with the top level project deliverable. The WBS hierarchical diagram is the best way to see and comprehend that relationship.
This article introduces the WBS hierarchy diagram view in Primavera P6 Professional. It is beyond the scope of this article to discuss proper WBS principles and creation in detail.
Top Down Scheduling
Primavera P6 is a top-down scheduling software program. What does this mean? Well, it means Primavera P6 has you define and decompose the deliverables first. The deliverable and/or deliverables you are producing are considered the top of the project schedule definition. The deliverables support the definition of activities required to produce those deliverables; activity definition flows from these deliverables. Because your project description flows from the deliverables and down to the activities, it is appropriate to label the Primavera P6 software as a top-down scheduling tool.
Bottom-Up Scheduling
Bottom-up scheduling software, like Microsoft Project, have you first list required tasks and then later consider what products and/or deliverables related tasks are producing. It is possible to consider deliverables first in Microsoft Project, but the software interface is more suited to defining and entering tasks first, and summary tasks, i.e. deliverables, later. In its effort to emphasize the importance and precedence of the WBS Primavera P6 Professional has a separate view for the WBS. Here the scheduler enters the WBS first before activity definition.
Creation of the WBS is an important step in the project scheduling process. It defines your deliverables and scope, which are the whole purpose of the project. The WBS helps you bracket the entire scope of the project. Its hierarchical layout allows you to easily see everything included in the scope. By implication everything not in the WBS is out of scope. The WBS itself is an implicit contract between the customer and subcontractors. Again, understanding the WBS is imperative for proper scheduling and management of the project. And the best view or picture for analyzing the WBS comes from the hierarchical diagram.
We begin, however, by displaying the outline or tabular view of a WBS in Figure 1.
 Figure 1
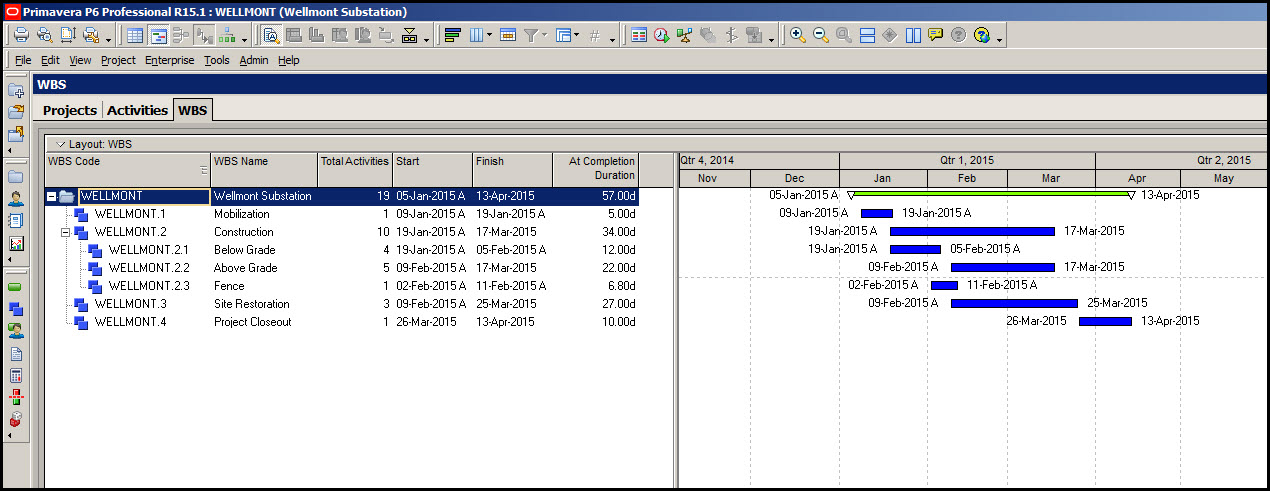
In Primavera P6 this is referred to as the Gantt chart view, as a project Gantt chart is displayed alongside the WBS outline view. The Gantt chart view of a WBS may be displayed by selecting the Gantt Chart icon in the top layout tool group. Doing this we see in Figure 1, a WBS of a project named Wellmont. This WBS outline view shows several levels of this project. For reasons that we will discuss later, it is recommended that you enter the WBS of your projects in Primavera P6 Professional using the Gantt chart view, and not the Chart view.
For instructions on how to enter a WBS in this Gantt chart view refer to the following blog “Creating A Work Breakdown Structure (WBS) In Primavera P6“.
Having entered your project’s WBS in the Gantt chart view select the Chart view icon in the top layout tool group to display a chart, i.e. hierarchical diagram, of the WBS, Figure 2.
Figure 2

In Figure 2 we have a nice chart view of the WBS that clearly displays WBS elements that are a parent, children of a parent, or siblings. This diagram view has connecting lines between WBS elements that help to clearly display the hierarchy of WBS elements.
In the end, you will have to choose for yourself your preference, Chart view or Gantt chart view. But let me show you a few Chart view tricks that make the WBS Chart view in Primavera P6 a compelling display for viewing, understanding, and reporting the WBS.
First, note the red circles in Figure 2 that highlight the minus (-) signs you can click on to collapse each level in the WBS hierarchy. Click on plus (+) signs to expand each respective level. In this way you can focus in on the elements of the WBS of interest to you.
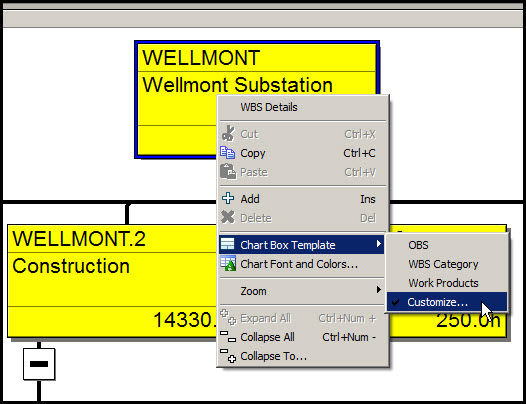
Second, right click on a WBS element, select Chart Box Template from the resulting menu, and then customize, Figure 3.
Figure 3
This brings up the Chart Box Template dialog, Figure 4.
Figure 4

If you click the + Add button, Figure 4, that adds a new field name, Figure 5,
Figure 5
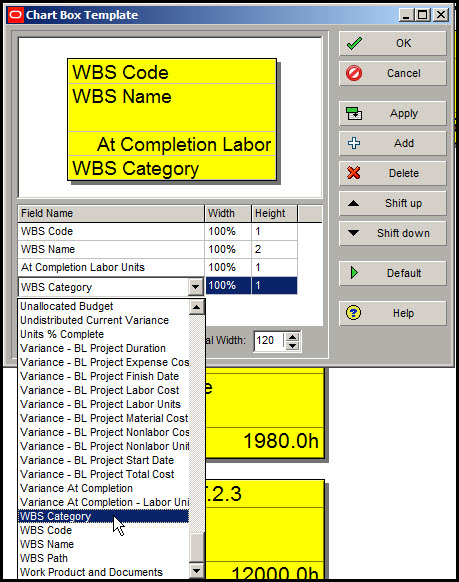
You can display in the WBS element box. Select the respective drop down menu to bring up a wealth of items you can display. For example, I select Budget at Completion, Figure 6.
Figure 6
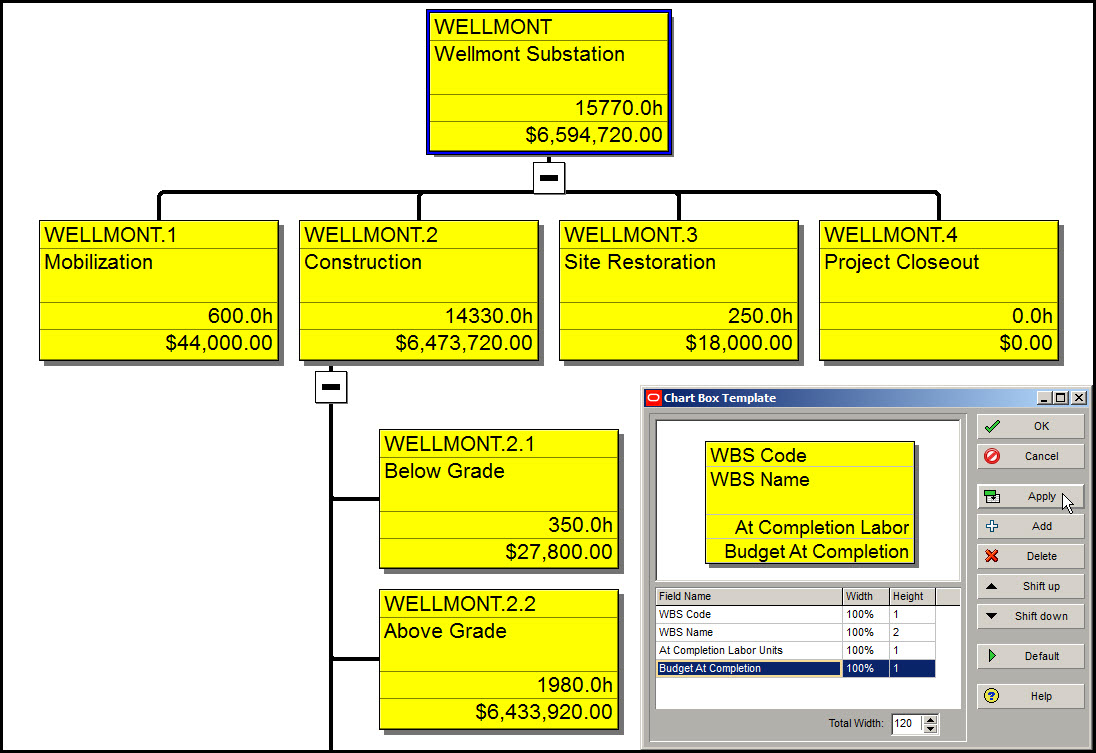
Hit apply and now all the WBS element boxes display the Budget at Completion, in addition to WBS Code, WBS Name, At Completion Labor Units. Take a step back now and look at the WBS hierarchy diagram we just created. We can quickly see the code and name of every WBS element, and additionally, labor units and budget. This is great for getting a quick and understandable view of the entire project.
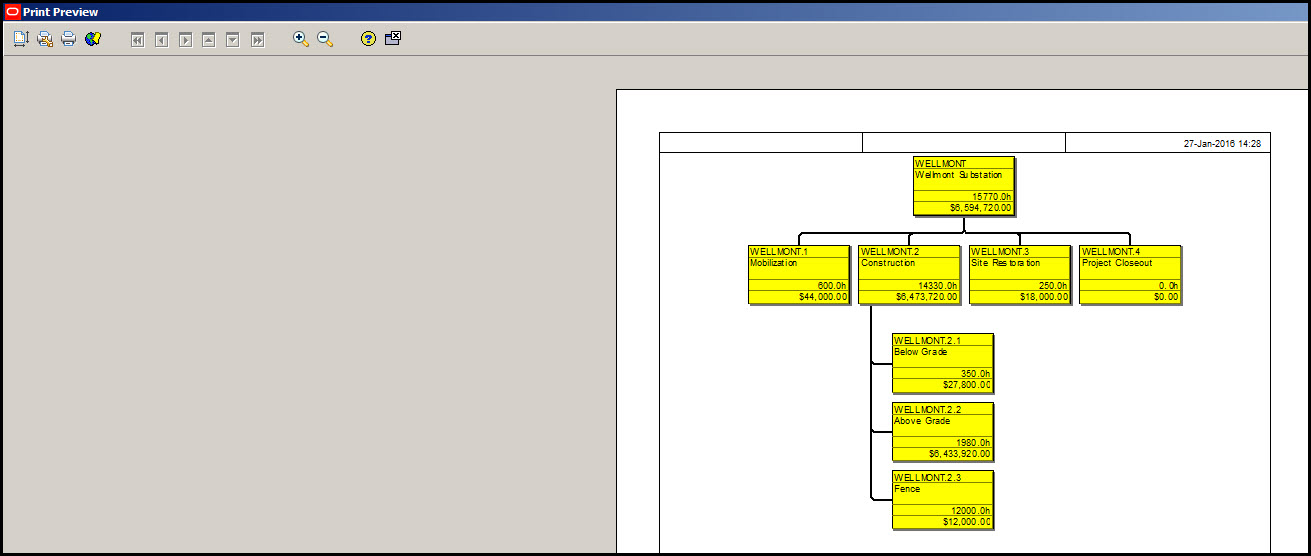
Third, you can print the Chart view WBS in an adobe PDF report. Most adobe programs come with both letter and legal (11”x17”) sized printouts, which will suffice for small projects. Figure 7 is a print preview of a letter sized report. Large projects may require ARCH-E size paper, consult the following link to down load a free ‘CutePDF Writer’ that comes with several ARCH-A and E sized printouts.
Figure 7
Summary
Primavera P6 Professional has some fairly advanced WBS display and reporting features in the Chart view, i.e. hierarchy diagram view. You can also add and move WBS elements directly in the Chart view. However, I have found the Chart view WBS element creation and move features to be somewhat quirky. From my experience it is more reliable to create and move WBS elements in the Gantt chart view, i.e. outline view. Having said that, I would still encourage you to experiment with using the Chart view WBS hierarchy editing features. But definitely use the Chart view’s display and reporting tools.