The Gantt chart is a powerful graphical presentation of your schedule. But did you know that Primavera P6 Professional also has an activity network diagram view that may better highlight the relationships between activities?
No doubt the Gantt chart has revolutionized the project management field. It provides a compelling graphical presentation of schedule activities and their relationships over time. However, you may only be interested in better understanding the relationships between activities. If this is your situation then you may want to view your schedule through the lens of an activity network diagram.
The network diagram depicts the sequence of activities by showing activities as terminal elements and their relationships as connecting arrows. In this way the network diagram highlights the relationships between activities. It also displays, similar to the Gantt chart, activities performed in series or parallel. The network diagram is not a replacement for the Gantt chart, but a valued complement.
This article examines the network diagram features in Primavera P6 Professional as a supplement to the Gantt chart.
We begin with our demonstration project in Figure 1.
 Figure 1

In this Gantt chart view we clearly see the duration of activities and their chronological placement on the calendar. Also, displayed are the relationships between activities. If you focus your attention accordingly on this demonstration Gantt chart you may decipher the many activities connected to the substantial completion activity.
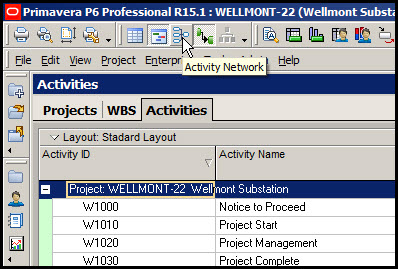
However, these relationships become more apparent with the introduction of a network diagram. So we select Activity Network in the top layout tool group at the top of the screen, Figure 2.
Figure 2
The resulting network diagram of our demonstration schedule is displayed in Figure 3.
Figure 3
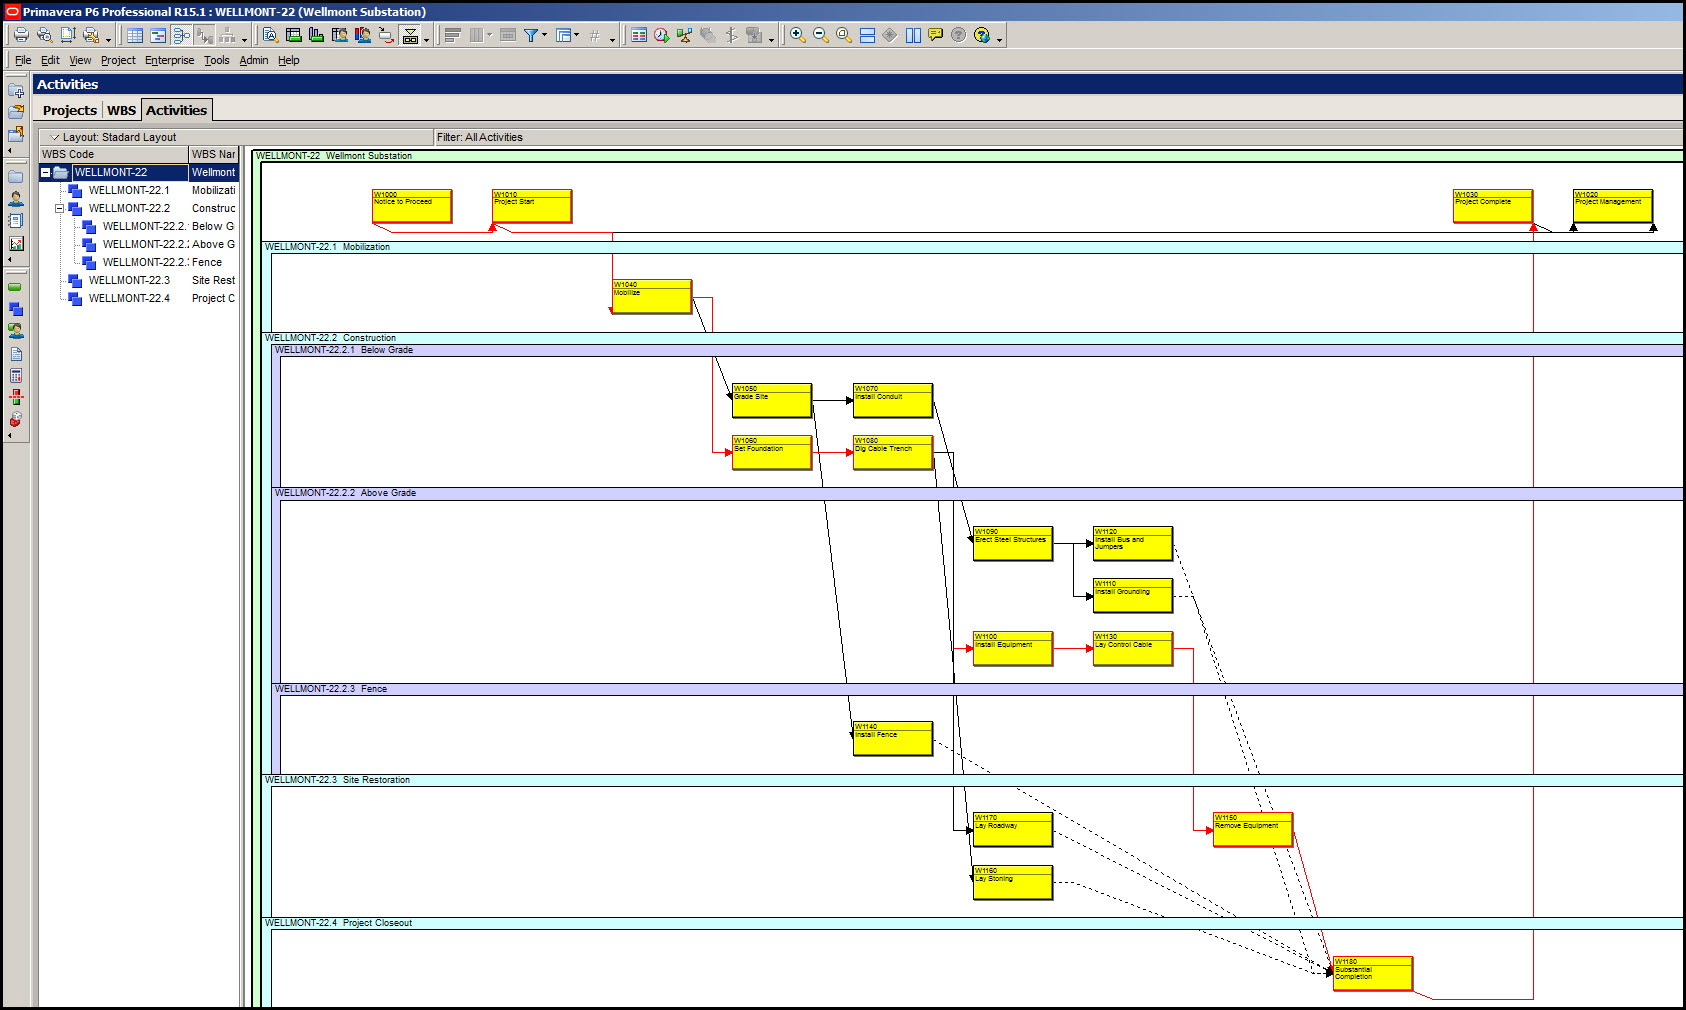
Here first note that Primavera P6 Professional groups network elements according to their associated Work Breakdown Structure (WBS) elements. Second note that the activity labeling and other pertinent information on each network element is not legible. The large project size requires small network element labeling to fit the entire project on the screen.
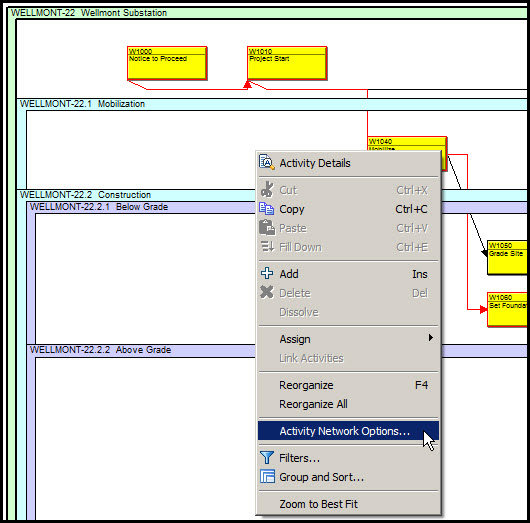
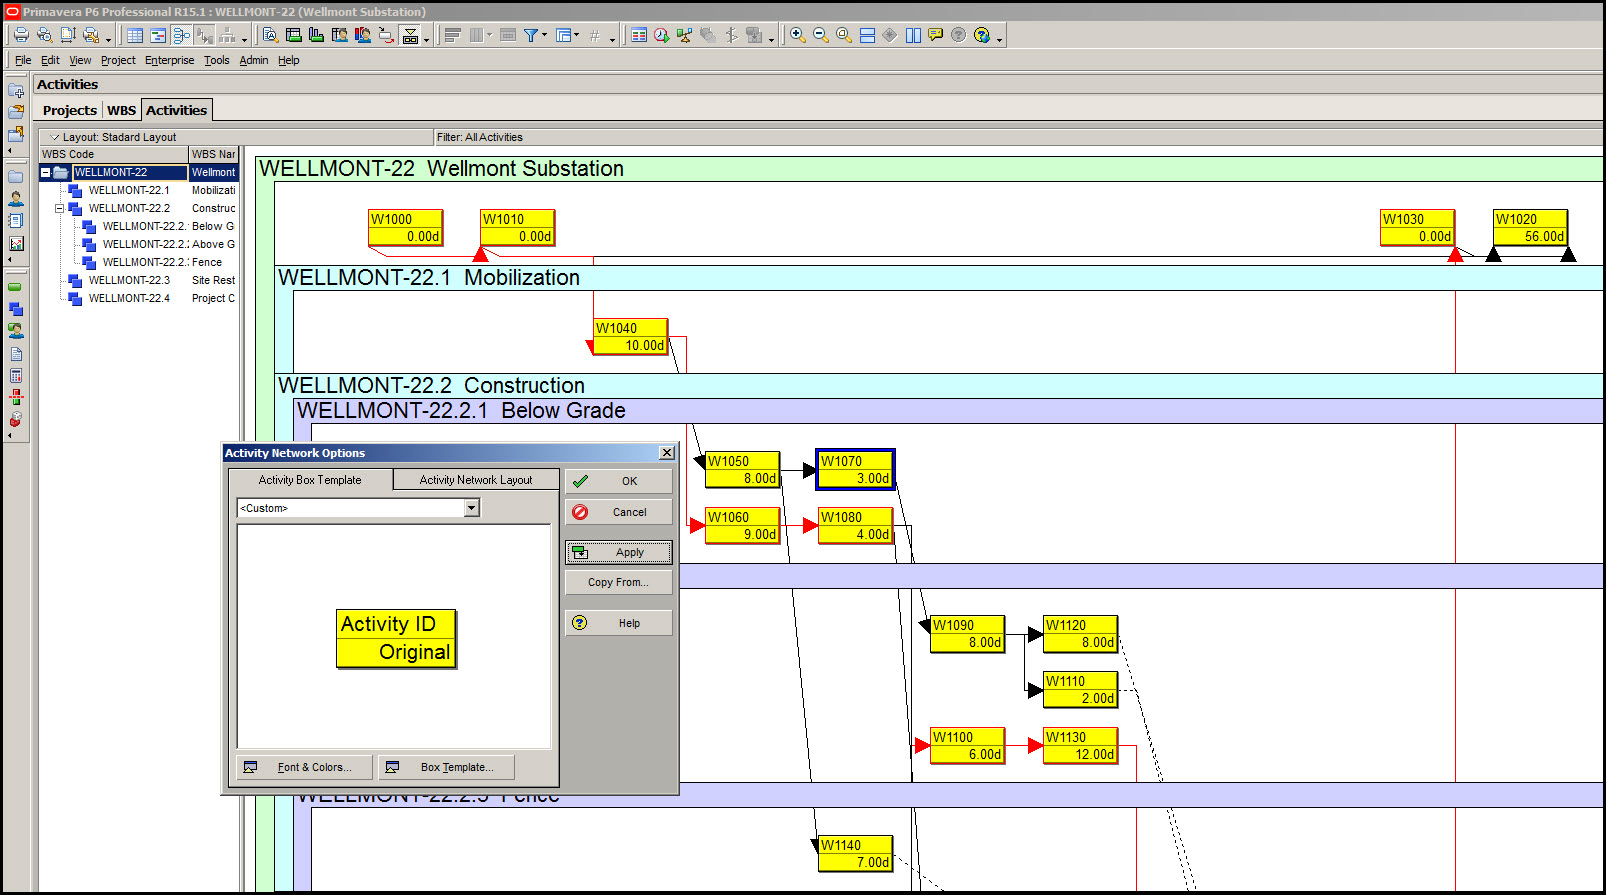
We can make adjustments to the amount of information displayed on the network elements to better view the entire project network. Right click on the network diagram and select Activity Network Options from the resulting menu, Figure 4.
Figure 4
In the Activity Box Template tab of the resulting Activity Network Options dialog select Activity ID from the drop down menu, Figure 5.
Figure 5
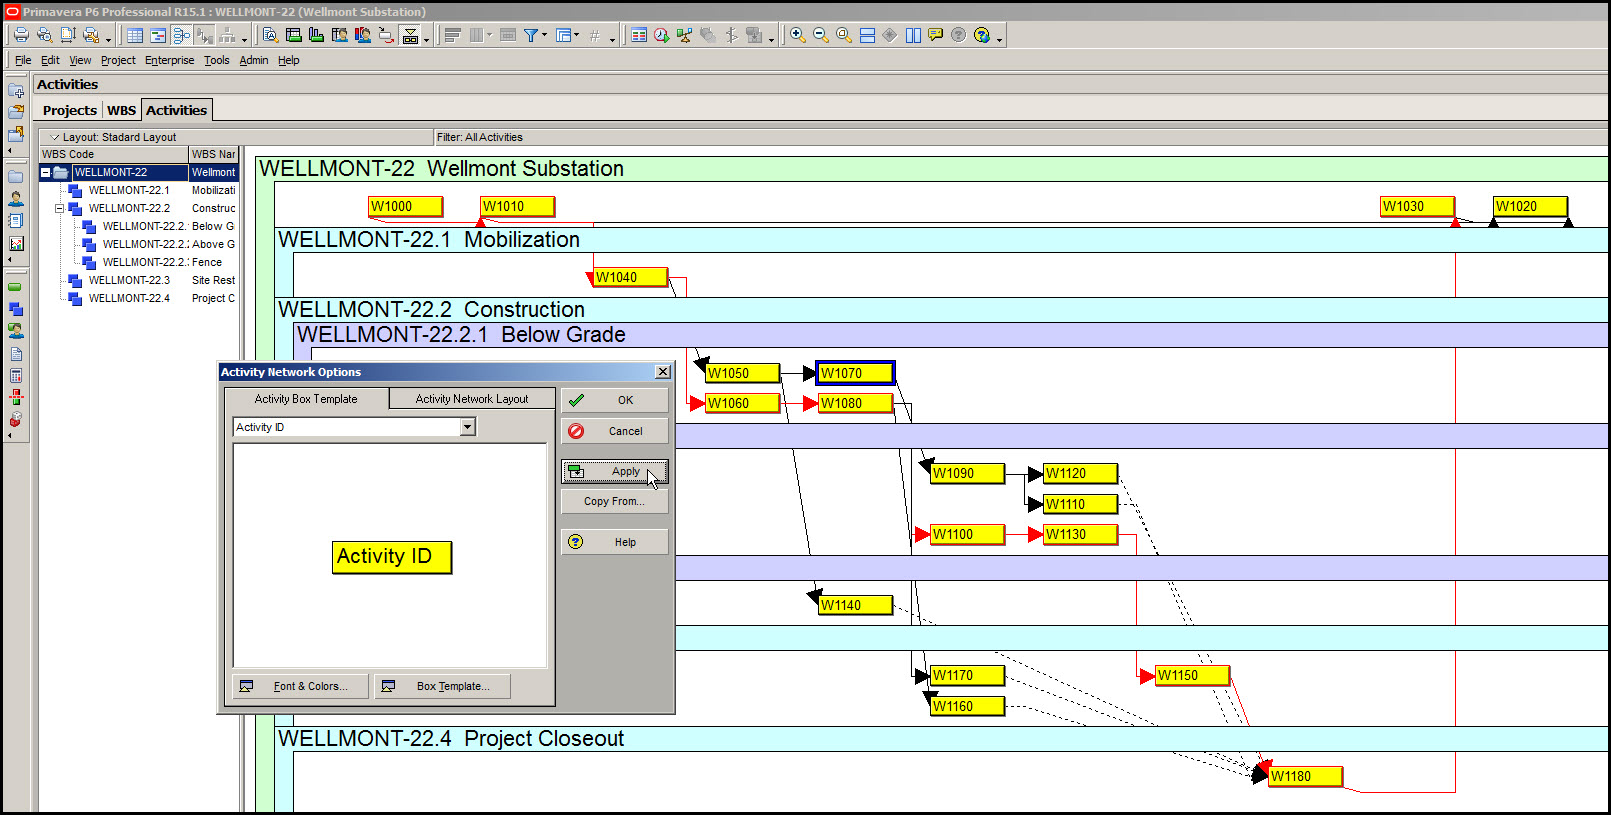
Click apply and now the network element labeling is more legible.
Now we have a better view of the entire schedule network diagram. From this view we see that activity W1180 has many activities connecting to it. Also, one of these activities is on the critical path; the red connect arrow indicates activities along the critical path. So when we consider implementing activity W1180 we have to pay attention to the completion of several activities, in particular, W1150, the critical activity. If you refer back to our Gantt chart view this many to one situation is not so apparent.
If we focus in on one section of the network, we than can display more information about each of the network elements. In Figure 6 we select Durations from the drop down menu in the Activity Box Template tab of the Activity Network Options dialog.
Figure 6
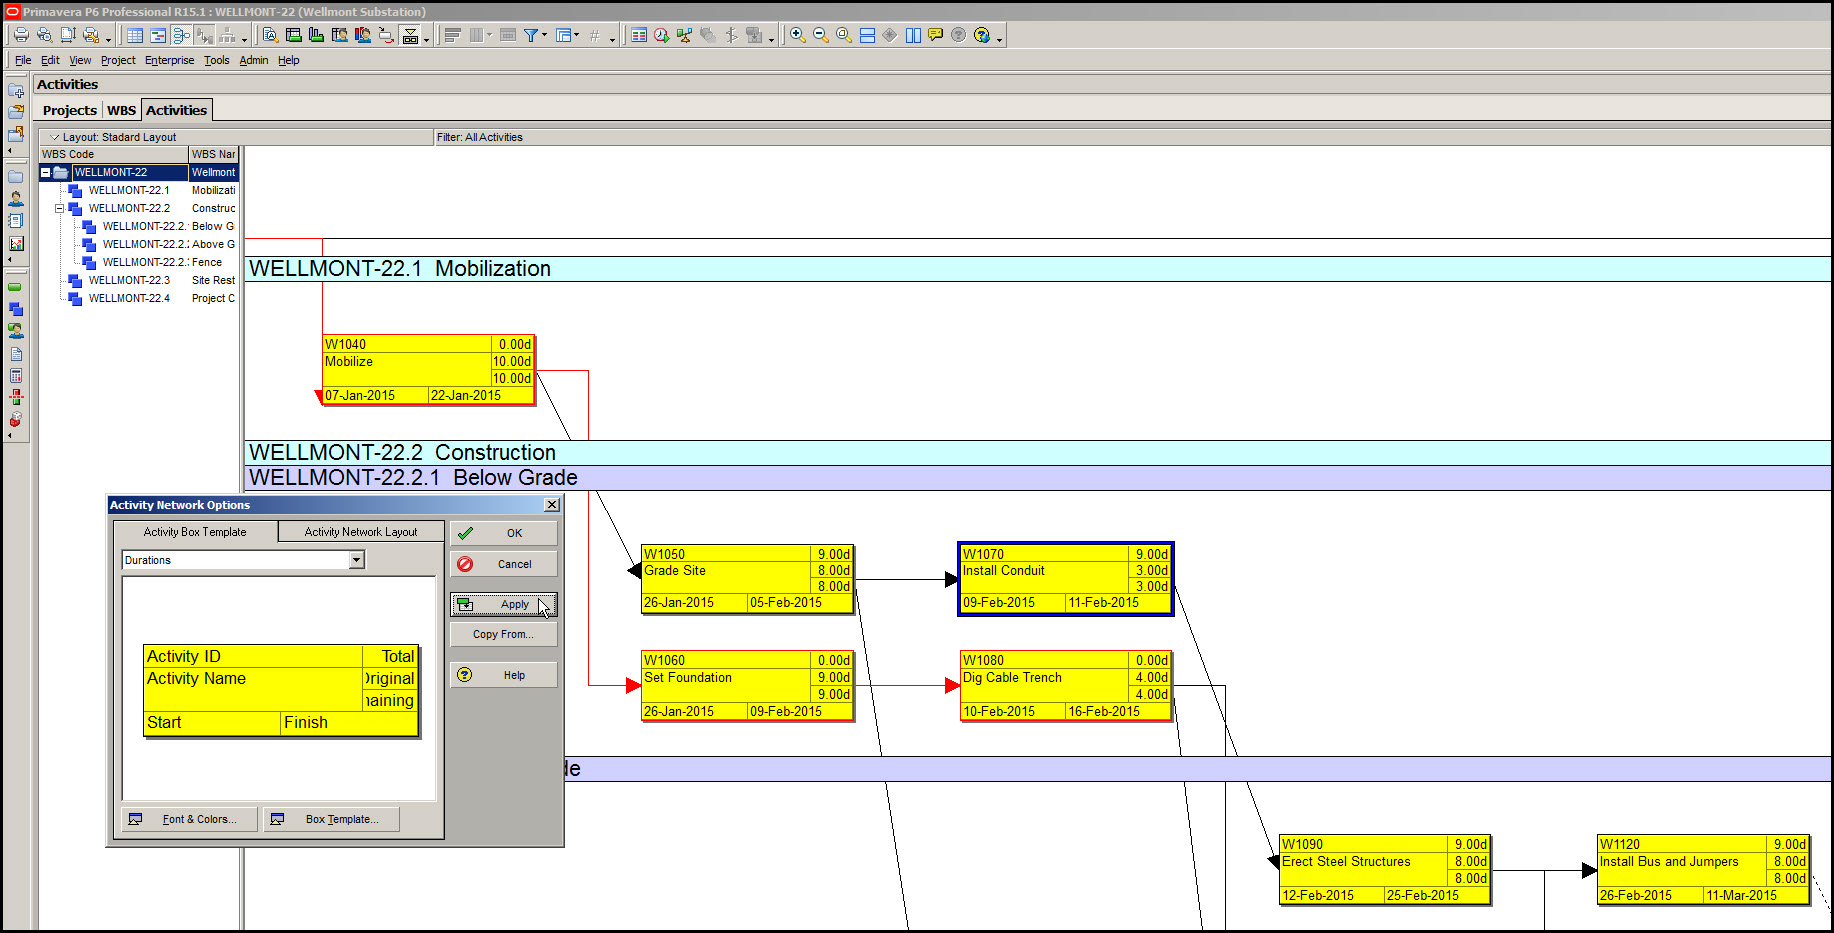
Click apply and we see much more information about each network element, including its name, original duration, and start and finish dates. But you may have to zoom in so that network element labeling is legible.
We can also customize the network element display. First select Activity ID (as a starting point) from the drop down menu of the Activity Box Template, Figure 7.
Figure 7
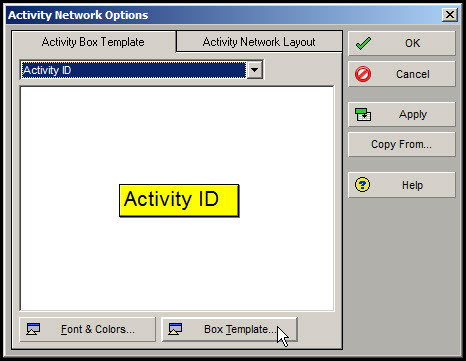
Then click Box Template. Up pops the Chart Box Template, Figure 8.
Figure 8
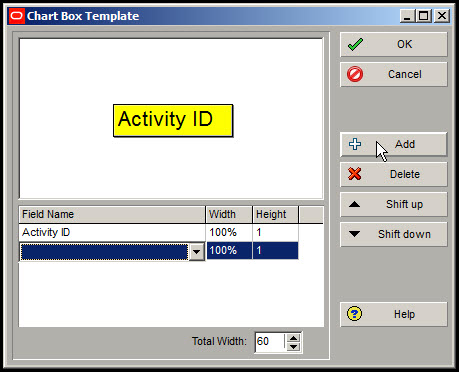
Click + Add to insert additional field names to the network element display. In the respective field name drop down menu we select original duration, Figure 9.
Figure 9
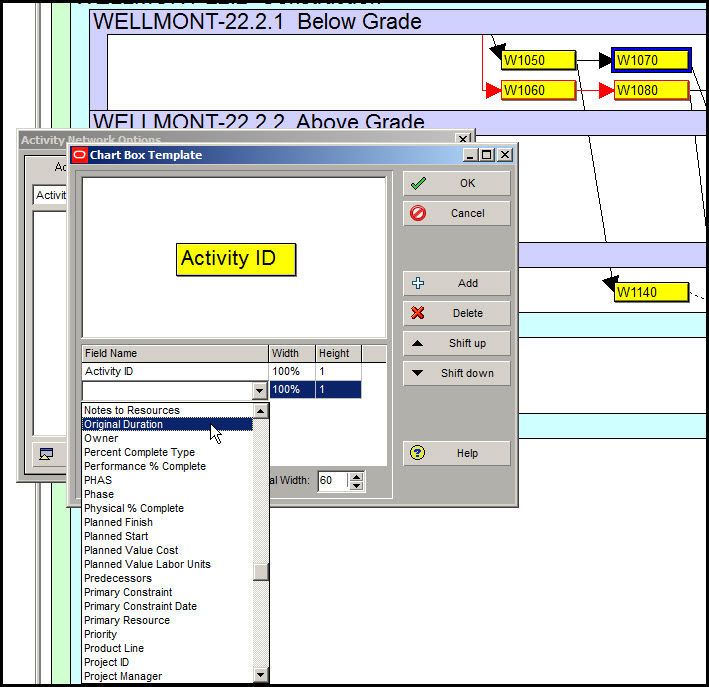
Click OK in the Chart Box Template dialog and then apply in the Activity Network Options dialog, Figure 10, and now we see the original duration displayed on all the network elements.
Figure 10
This is just one example of how you can personalize what’s displayed on each activity network element. But it should be apparent that there is a plethora of labels that are available for display.
One last useful feature in the network diagram view is that you can edit activity relationships directly in the Activity Network view. Double click on any relationship, as we do in Figure 11 (note the mouse arrow and the highlighted blue relationship line), and the Edit Relationship dialog appears, Figure 12.
Figure 11
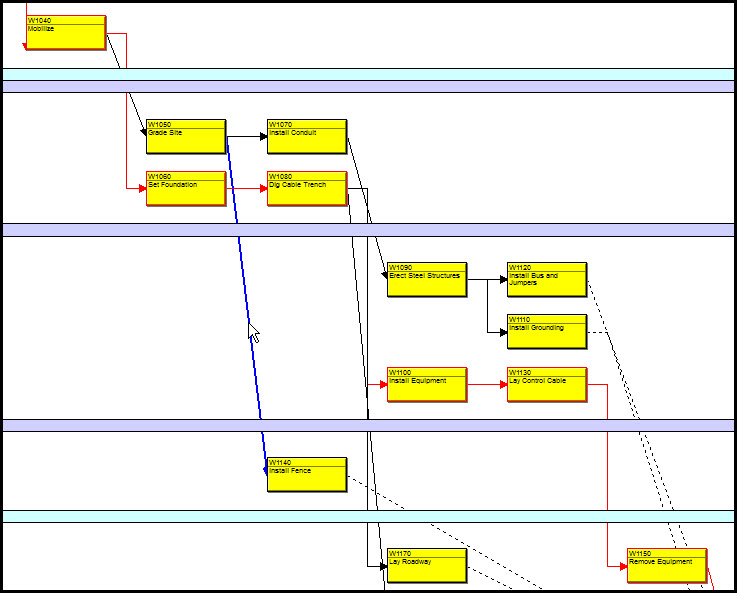
Figure 12

This is the same Edit Relationship dialog that appears when we double click on a relationship in the Gantt chart view. In this Edit Relationship dialog we can delete the relationship, change the relationship type, or add lag.
Summary
The activity network view is a nice complement to the Gantt chart view. For certain schedules it may provide more insight into the relationships between activities. The network diagram in Primavera P6 Professional is an abundant feature in that you can choose from a wealth of information to display on each network element.
You may, however, have to limit information in order to display the entire schedule network in a way that each network element’s labeling is visible. Again, the activity network view is not a replacement of the Gantt chart, but a supplement. And it even has some editing features so you can make minor changes to the schedule directly in the activity network view.