• Skip to main content
  • Skip to primary sidebar
  • Skip to footer

Ten Six Consulting

Project and Earned Value Management, Primavera P6 & Deltek Cobra & Acumen Services

703-910-2600
  • Training
    • Primavera P6 Training
    • Deltek Training
    • Microsoft Project Training
    • Project Management Training
    • Earned Value Management Training
    • Open Training Class Dates
    • Customized Video Training Classes
  • Consulting
    • Project Management
      • Assessments and Health Checks
      • Organizational Change Management
      • Project Governance
      • Project Management Tool Selection
      • Risk Analysis Services
      • Scheduling Services
      • Project Management Staff Augmentation
    • Project Management Office (PMO)
      • PMO Pulse Check
      • PMO Implementation Planning
      • PMO Organization Change Management
      • PMO Project Manager Leadership Development
      • PMO Planning Best Practices
      • PMO Scheduling Best Practices
      • PMO Enterprise Tool Training
      • Program Manager Challenges
    • Earned Value Management
      • EVMS RFP Support
      • EVMS Assessments
      • Earned Value Management Tool Selection
      • EVMS System Description and Process Development
      • Integrated Baseline Review (IBR) Preparation and Conduct
      • EVM Certification Support
      • Integrated Master Schedule (IMS) Health Check
      • Action Plan Development for Progress Assessment Reviews
      • Earned Value Data Analysis and Reporting
      • WBS Guidelines for Government Acquisition Programs (MIL-STD 881D)
      • EVMS Staff Augmentation
    • Risk Management
      • Risk Management Support and Consulting
      • Risk Management Maturity Assessment® (RMMA)
      • Risk Management Checkup Services (RMCS®)
      • Risk Management Training and Workshops
    • Portfolio Management
      • IT Portfolio Management
      • Corporate Governance Portfolio Management
      • Product Portfolio Management
      • Public Sector Portfolio Management
      • New Product Development Portfolio Management
    • ISO 21500 Assessment
  • Software
    • Primavera P6
      • Primavera P6 Application Consulting
      • Primavera P6 BI Publisher Services
      • Primavera P6 Technical Consulting
      • Primavera P6 Integration
      • Primavera P6 Knowledge Transfer, Mentoring and Coaching
      • Primavera P6 Staff Augmentation
    • Primavera Unifier
    • Deltek Cobra
      • Deltek Cobra Application Consulting
      • Deltek Cobra Knowledge Transfer, Coaching and Mentoring
      • Deltek Cobra Integration
      • Deltek Cobra Staff Augmentation
    • Microsoft Project
      • Building an Integrated Master Schedule (IMS)
      • Integrating Microsoft Project with Deltek Cobra
      • Migrating From Microsoft Project To Oracle Primavera P6
      • Microsoft Project to Primavera P6 Conversion Service
  • Blog
    • Deltek Acumen
    • Deltek Cobra
    • Earned Value Mgmt
    • Microsoft Project
    • PMO
    • Primavera P6
    • Project Management
    • Risk Management
  • Clients
  • About Ten Six
  • Contact Us

Using The Network Diagram In Microsoft Project

You are here: Home / Microsoft Project / Using The Network Diagram In Microsoft Project

December 9, 2015 By Ten Six

The logic of the project schedule has a significant impact on how the schedule proceeds. It is important to know, in particular, which activities are performed in parallel or series. The best way to clearly see your schedule’s task logic is to display a network diagram of your schedule.

The Gantt chart provides a powerful graphical representation of the project. It includes the start, duration, and finish of each task on a timeline. It also displays the relationships between activities. In some cases, however, the Gantt chart displays too much information. Sometimes you want to focus in on the relationships between tasks without being encumbered by activity durations and/or an activity timeline. It is good to clearly see what activities are performed in parallel as they will, most likely, require more coordination and/or logistics. The network diagram highlights the relationships between tasks, so you can easily view tasks in parallel and series.

This article discusses how to display a network diagram of your schedule to more clearly see and understand the relationships between tasks.

We have in Figure 1 our demonstration project.

Using a Microsoft Project Network Diagram Fig 1Figure 1

Note the tasks in red are along the critical path and tasks in blue are non-critical. Looking closer we see that some activities, such as Grade Site and Set Foundations, are performed in parallel. Others, such as Lay Control Cable and Remove Equipment are in a strict series relationship. We want a better understanding of task relationships, so we can coordinate activities, particularly those performed in parallel. A network diagram will help us focus in on the activity relationships.

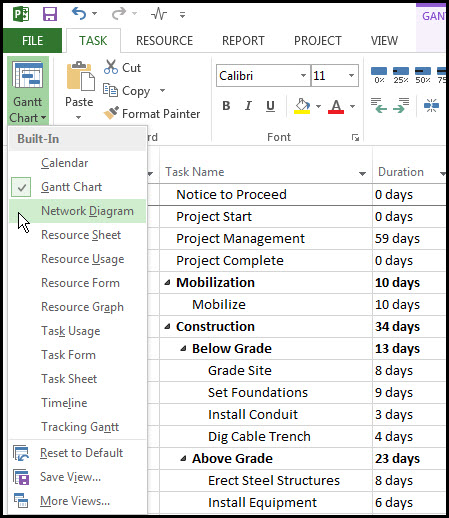
To display a network diagram of the schedule select the Task tab, View ribbon group, Gantt chart drop down menu, and Network Diagram, Figure 2.

Using a Microsoft Project Network Diagram Fig 2Figure 2

The network diagram for our demonstration project is displayed in Figure 3.

Using a Microsoft Project Network Diagram Fig 3Figure 3

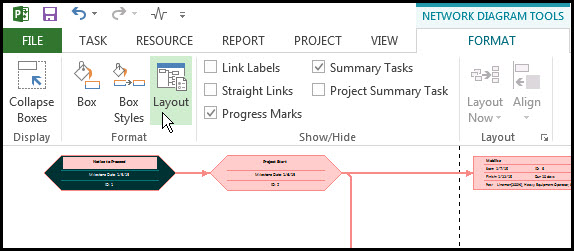
Note the nodes that are not connected are summary tasks. Because these nodes are not providing any useful information let’s remove them from our network diagram. To do this select the Format tab, Format ribbon group, and Layout, Figure 4.

Using a Microsoft Project Network Diagram Fig 4Figure 4

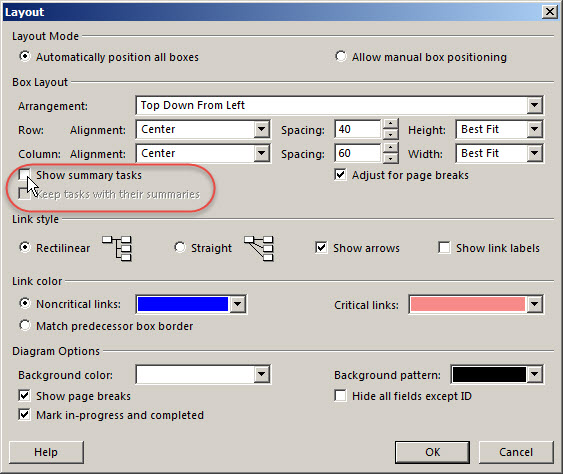
In the resulting Layout diagram toggle off, “Show summary tasks”, Figure 5.

Using a Microsoft Project Network Diagram Fig 5Figure 5

In Figure 6 we again show the network diagram without summary tasks.

Using a Microsoft Project Network Diagram Fig 6Figure 6

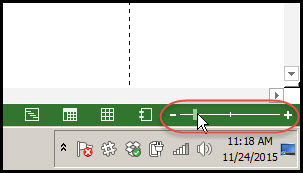
The main issue now is that we cannot see the entire schedule in the network, so we use the zoom scroll in the lower right corner of the screen, Figure 7, to adjust the size of the display.

Using a Microsoft Project Network Diagram Fig 7Figure 7

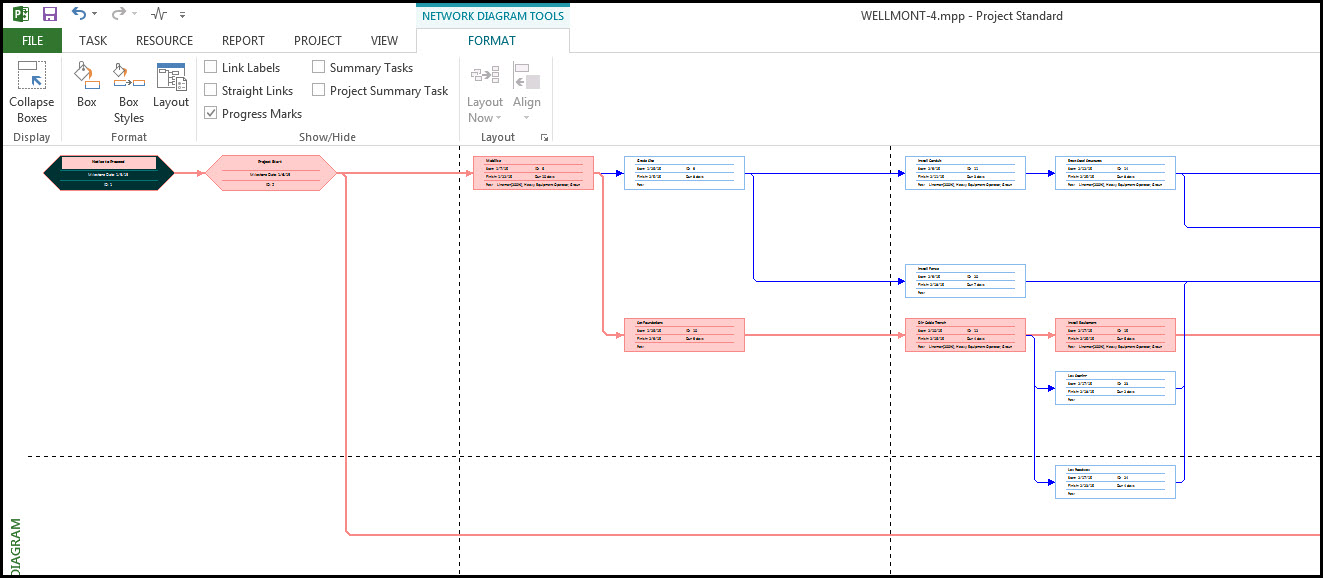
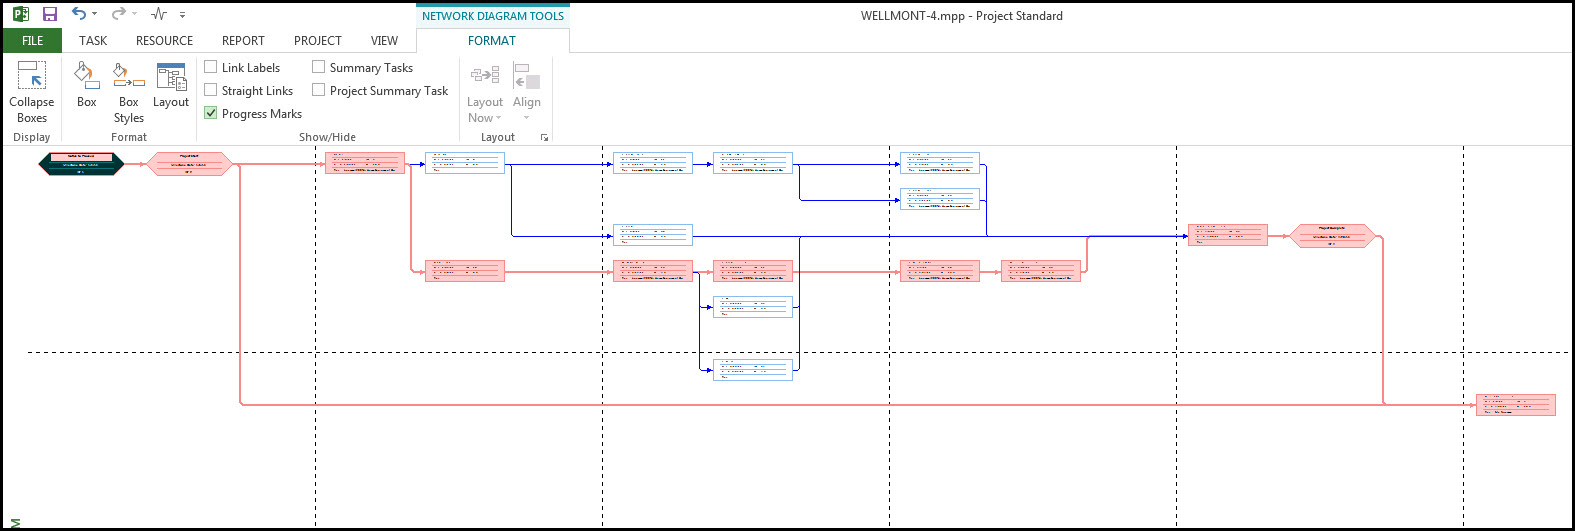
Now we see the whole schedule’s network diagram in Figure 8.

Using a Microsoft Project Network Diagram Fig 8Figure 8

If we zoom in we can see the schedule details provided for each network node, Figure 9.

Using a Microsoft Project Network Diagram Fig 9Figure 9

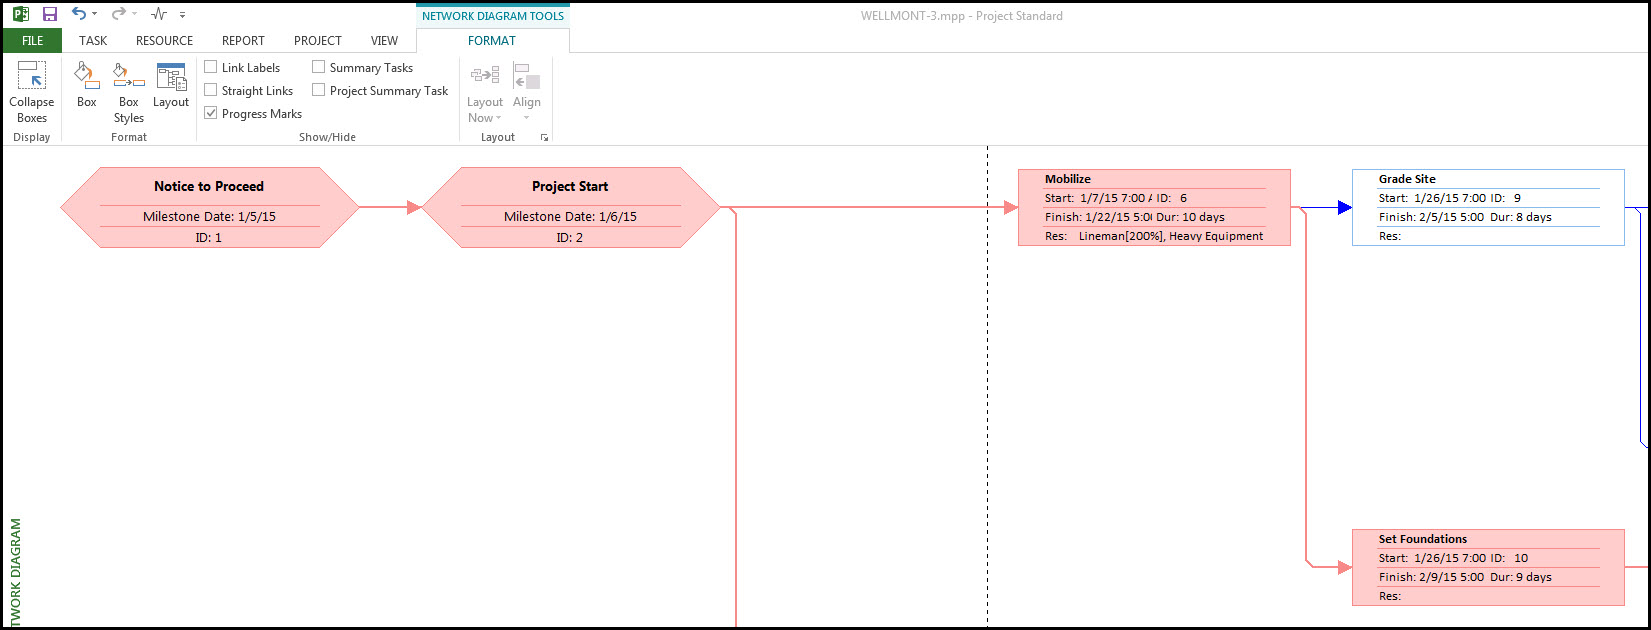
In Figure 9 the milestones Notice to Proceed and Project Start are distinguished by their hexagonal shape. Task nodes are rectangular in shape. Critical tasks are in red and non-critical are blue. Each task node provides the task name, start, finish, duration, resources, and ID. This is probably more information than we need and it makes distinguishing any task node information near impossible or difficult to read when the entire schedule network is displayed, as in Figure 8.

Let’s simplify the node details using the Layout dialog, Figure 10.

Using a Microsoft Project Network Diagram Fig 10Figure 10

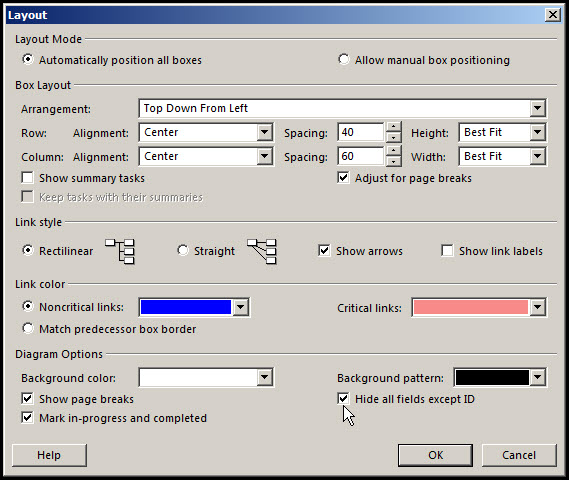
In the Layout dialog toggle on ‘Hide all fields except ID’. Now we can clearly see the entire schedule network and associated IDs, Figure 11.

Using a Microsoft Project Network Diagram Fig 11Figure 11

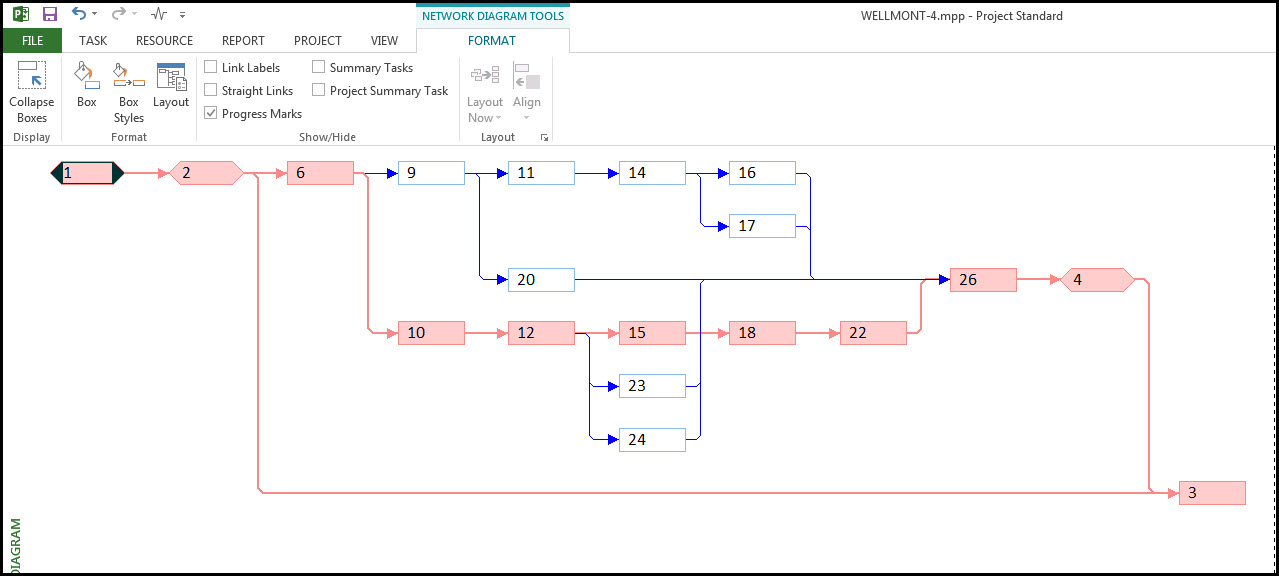
We also know that if we want more information on a network node we simply toggle off ‘Hide all fields except ID’. With only the ID displayed as in Figure 11 we can easily see the entire network in a way that provides useful insight. The node (task) predecessor and successor is apparent for each node. The critical path is clearly visible. We can also distinguish the nodes or tasks performed in parallel and/or series.

Summary

When you really want to focus in on task relationships and to note tasks performed in parallel you’ll want to become familiar with the Network Diagram view in Microsoft Project. The network diagram is not a timescale, nor does it graphically display task durations. It has less information than the Gantt chart, particularly when ‘Hide all fields except ID’ is employed.

However, it helps to better understand task relationships, the critical path, the sequence of tasks, and the parallel verses series occurrence of tasks. The network diagram is an example where less is more. The network diagram does away with the schedule timescale and graphical depiction of the task durations, in return it provides a better understanding of schedule logic, which is what you really need, particularly on large complex projects.

Primary Sidebar

  • This field is for validation purposes and should be left unchanged.
  • Facebook
  • LinkedIn
  • Twitter

Categories

  • Deltek Acumen
  • Deltek Cobra
  • Earned Value Mgmt
  • Microsoft Project
  • PMO
  • Primavera P6
  • Project Management
  • Risk Management

Archives

Footer

Upcoming Classes

Primavera P6 Professional Fundamentals

Primavera P6 EPPM Fundamentals

Primavera P6 EPPM Administrator

Oracle Primavera P6 BI Publisher Fundamentals Training Class

EVMS Training

Deltek Cobra Fundamentals Training

Deltek Cobra Advanced Training Class

Deltek Acumen Fuse Training Class

Copyright © 2021 · Ten Six Consulting, LLC · 703.910.2600

  • Training
    ▼
    • Primavera P6 Training
    • Deltek Training
    • Microsoft Project Training
    • Project Management Training
    • Earned Value Management Training
    • Open Training Class Dates
    • Customized Video Training Classes
  • Consulting
    ▼
    • Project Management
      ▼
      • Assessments and Health Checks
      • Organizational Change Management
      • Project Governance
      • Project Management Tool Selection
      • Risk Analysis Services
      • Scheduling Services
      • Project Management Staff Augmentation
    • Project Management Office (PMO)
      ▼
      • PMO Pulse Check
      • PMO Implementation Planning
      • PMO Organization Change Management
      • PMO Project Manager Leadership Development
      • PMO Planning Best Practices
      • PMO Scheduling Best Practices
      • PMO Enterprise Tool Training
      • Program Manager Challenges
    • Earned Value Management
      ▼
      • EVMS RFP Support
      • EVMS Assessments
      • Earned Value Management Tool Selection
      • EVMS System Description and Process Development
      • Integrated Baseline Review (IBR) Preparation and Conduct
      • EVM Certification Support
      • Integrated Master Schedule (IMS) Health Check
      • Action Plan Development for Progress Assessment Reviews
      • Earned Value Data Analysis and Reporting
      • WBS Guidelines for Government Acquisition Programs (MIL-STD 881D)
      • EVMS Staff Augmentation
    • Risk Management
      ▼
      • Risk Management Support and Consulting
      • Risk Management Maturity Assessment® (RMMA)
      • Risk Management Checkup Services (RMCS®)
      • Risk Management Training and Workshops
    • Portfolio Management
      ▼
      • IT Portfolio Management
      • Corporate Governance Portfolio Management
      • Product Portfolio Management
      • Public Sector Portfolio Management
      • New Product Development Portfolio Management
    • ISO 21500 Assessment
  • Software
    ▼
    • Primavera P6
      ▼
      • Primavera P6 Application Consulting
      • Primavera P6 BI Publisher Services
      • Primavera P6 Technical Consulting
      • Primavera P6 Integration
      • Primavera P6 Knowledge Transfer, Mentoring and Coaching
      • Primavera P6 Staff Augmentation
    • Primavera Unifier
    • Deltek Cobra
      ▼
      • Deltek Cobra Application Consulting
      • Deltek Cobra Knowledge Transfer, Coaching and Mentoring
      • Deltek Cobra Integration
      • Deltek Cobra Staff Augmentation
    • Microsoft Project
      ▼
      • Building an Integrated Master Schedule (IMS)
      • Integrating Microsoft Project with Deltek Cobra
      • Migrating From Microsoft Project To Oracle Primavera P6
      • Microsoft Project to Primavera P6 Conversion Service
  • Blog
    ▼
    • Deltek Acumen
    • Deltek Cobra
    • Earned Value Mgmt
    • Microsoft Project
    • PMO
    • Primavera P6
    • Project Management
    • Risk Management
  • Clients
  • About Ten Six
  • Contact Us