Schedulers are always looking for quick ways to spot trouble in their project schedule. The good news is that Microsoft Project has a number of great features to assist in this effort. Here are some quick ways to monitor schedule progress in Microsoft Project.
As projects become larger it becomes increasingly difficult to track the schedule progress. Microsoft Project has fields that support labeling the status of tasks in the table view. Also, the progress line on the Gantt chart provides a discrete graphical representation of task progress.
This feature is particularly nice because it plots progress right on top of the task precedence logic. But when you really need to focus in on all late or slipping tasks, Microsoft Project has filters for listing tasks that are falling behind schedule.
This article examines Microsoft Project’s fields, progress lines, and filters for monitoring the progress of schedule tasks.
Status Fields
We have in Figure 1 our demonstration project schedule.
 Figure 1
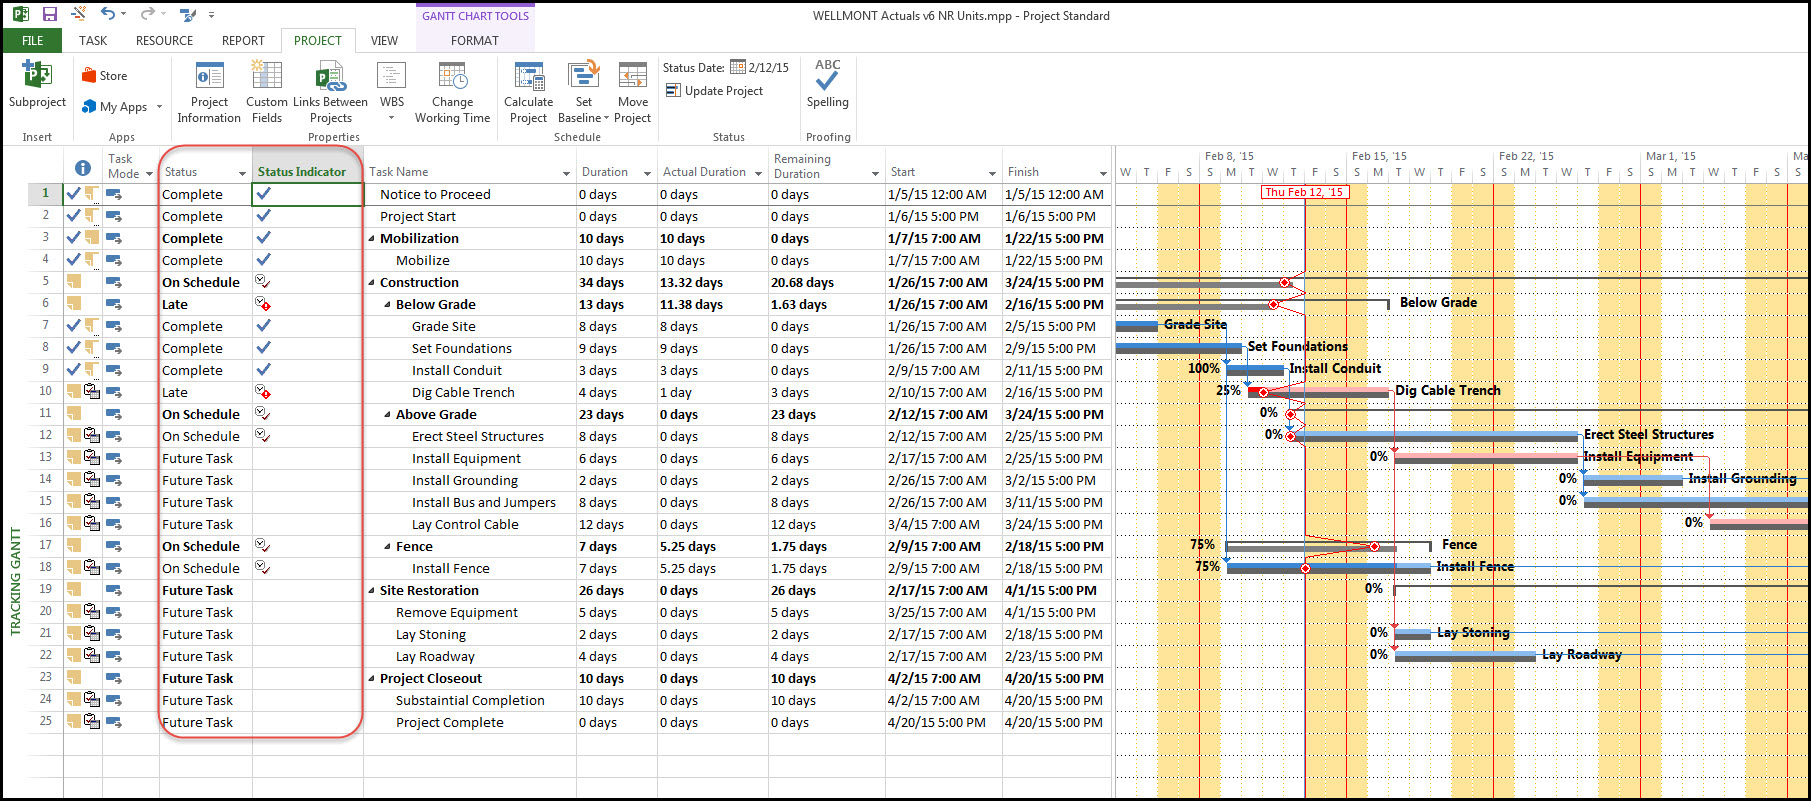
This schedule has several weeks of task progress updates. Note the two columns displaying Status and Status Indicator fields, Figure 1. The Status field marks respective tasks as Complete, On Schedule, Late, or Future. The Status Indicator field complements the Status with icons indicating Task completion, behind schedule, and on schedule.
Insert the Status and Status Indicator fields into your table by right-clicking on any column, choosing insert column from the drop down menu, and selecting Status or Status Indicator from the list. Great! Now you can go down your table of tasks to find the status of each task.
Progress Line
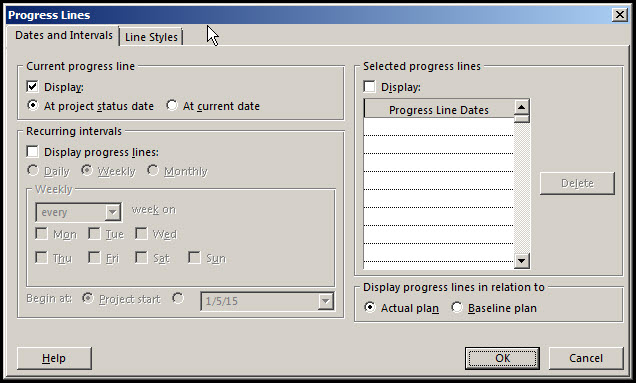
Figure 1 also displays a Progress Line directly on the Gantt chart. To display the Progress Line, select the Format tab, Format ribbon group, Gridlines drop down menu, and Progress Lines. In the Progress Lines dialog, Figure 2, select the Dates and Intervals tab, and in the Current progress line frame toggle on Display and At project status date.
Figure 2
In the Line Styles tab select either one of the Line Styles on the left, Figure 3.
Figure 3

Note the color and progress point shape. Toggle on show date for each progress line, and select a suitable date format. This will then display a Progress Line at the Status Date, which for this project is Thursday, February 12th COB, 2015.
Note spikes to the left on the Progress Line, Figure 1. These are tasks and/or deliverables that are behind schedule. Also, be aware that the spike connects to the point on the taskbar that represents the task’s percentage complete for its duration. The vertical portions of the Progress Line indicate that a task and/or deliverable is on schedule.
Note the Fence summary task, i.e. deliverable, spikes to the right indicating that this deliverable is ahead of schedule. Yes, the Status column simply states that this summary task is On Schedule. The progress line for this summary task actually tells you good news; it is ahead of schedule.
In Figure 4 we have scheduled all incomplete tasks to start after the Status Date, February 12th, COB, 2015.
Figure 4
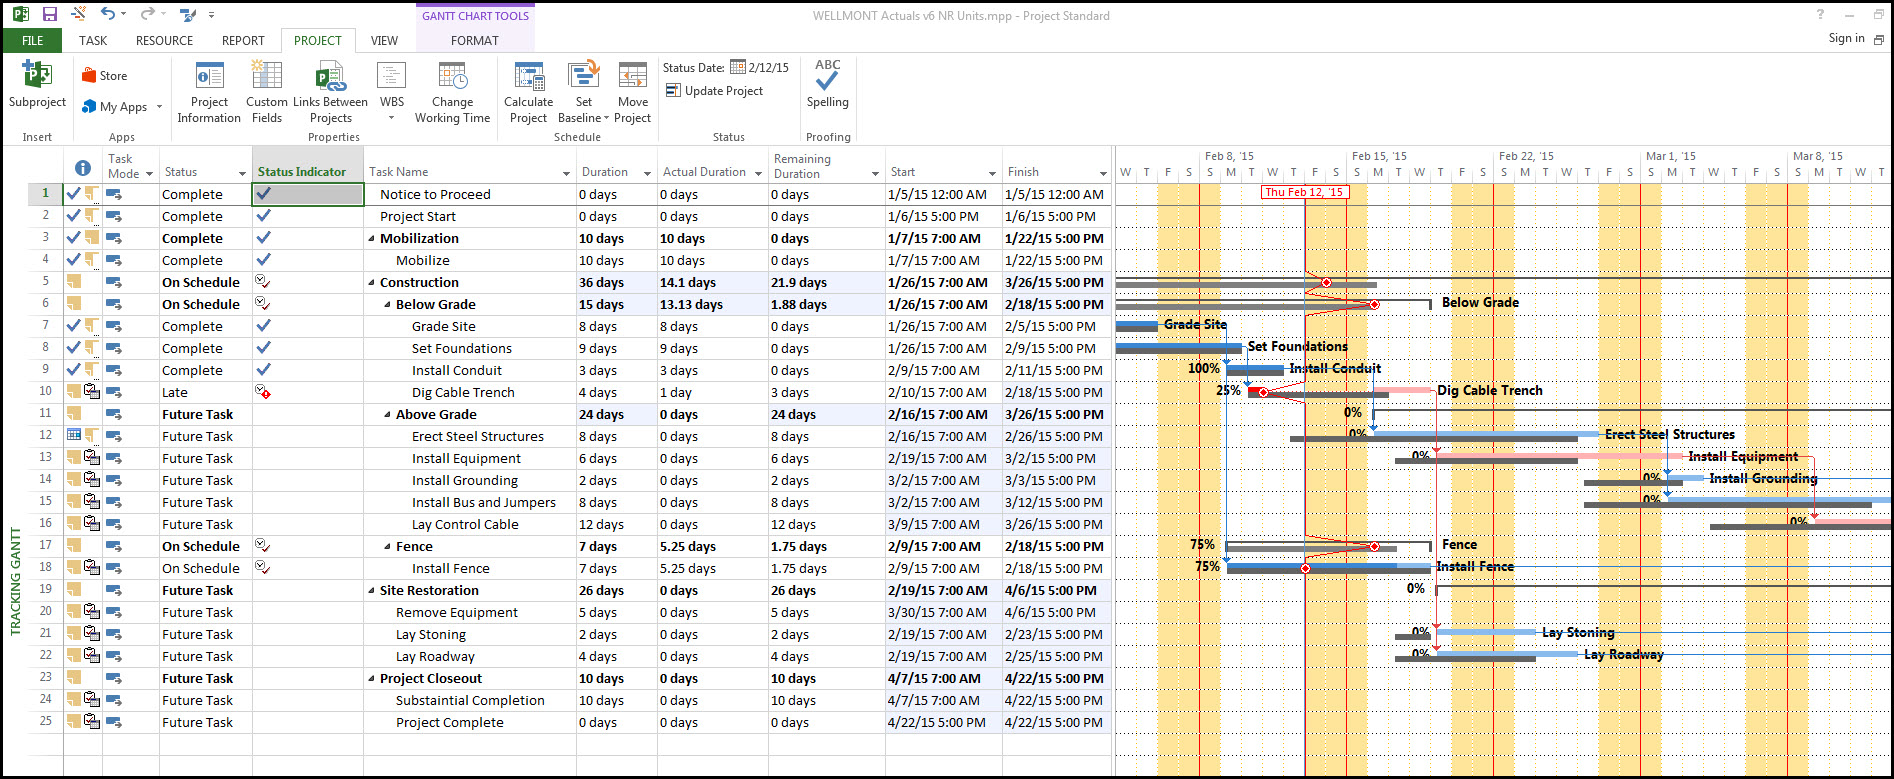
We rescheduled several activities to start on Monday. Note, in particular, Erect Steel Structures and Install Equipment tasks. Both of these tasks have zero percent complete, and are shifted to the right of their baselines. Still, the Progress Line indicates that these tasks are On Schedule by the vertical Progress Line section. The status field in the task table lists these tasks as Future Task. We know, however, by looking at their baselines that they are behind schedule.
Slipping Task Filter
Is there another way to spot these slipping tasks that are never-the-less labeled Future Task in the Status field? Yes, there is! It is possible to filter all tasks that have finish dates that are later than their baseline finish date. These tasks are late and you can list all the slipping tasks in your schedule using the Slipping Tasks filter. Select the View tab, Data ribbon group, Filter drop down menu, and More Filters. In the More Filters dialog, Figure 5, toggle Filters to Task and select the ‘Slipping Tasks’ filter.
Figure 5

Click apply and all tasks that are slipping from their baselines will be displayed, Figure 6, regardless of whether or not these tasks are rescheduled as Future Tasks.
Figure 6

Summary
Finding the status of tasks quickly is essential for the project manager to have some time to make proper schedule adjustments. The larger the project the more challenging it becomes to spot all tasks and/or deliverables that are behind schedule.
Microsoft Project provides Status and Status Indicator fields to support identifying the task situation in the activity table. These fields make a great reference point for status indication. The progress line is a good graphical presentation of each tasks situation as per the status date. You can also include additional progress lines on the current date or any other date of interest, so you can have multiple progress lines.
When you need a comprehensive list of all slipping tasks, i.e. tasks with scheduled finish dates later than their baseline finish dates, the Slipping Tasks filter is a great feature. From reference fields, to visual graphics, and, finally, to filters Microsoft Project supports the effort to understand the current status of the project. Familiarity with these features is important for the project manager to decipher and rapidly adjust to the project’s situation.