Most schedulers are familiar with the term total float. But what about free float? Free float is a helpful tool for measuring the likelihood of a predecessor activity affecting other linked successor activities. Let’s take a look at how to utilize both free float and total float.
The Gantt chart is a valuable scheduling tool. Notably, the Gantt chart displays the critical path, which includes all the activities that cannot be delayed without affecting the project end date. The total float is the amount an activities progress can be extended without delaying critical path activities, and, therefore, the project.
Free float, however, shows how much an activity can be postponed without disturbing a successor activity. Free float is a more stringent measure than total float. In Primavera P6 EPPM both total float and free float may be tabulated and displayed directly on the Gantt chart for quick analysis.
This article describes how to tabulate and display the total float and free float on the Gantt chart in Primavera P6 EPPM.
Let’s go ahead and take a look in Figure 1 at a schedule that clearly displays both total float and free float.
 Figure 1
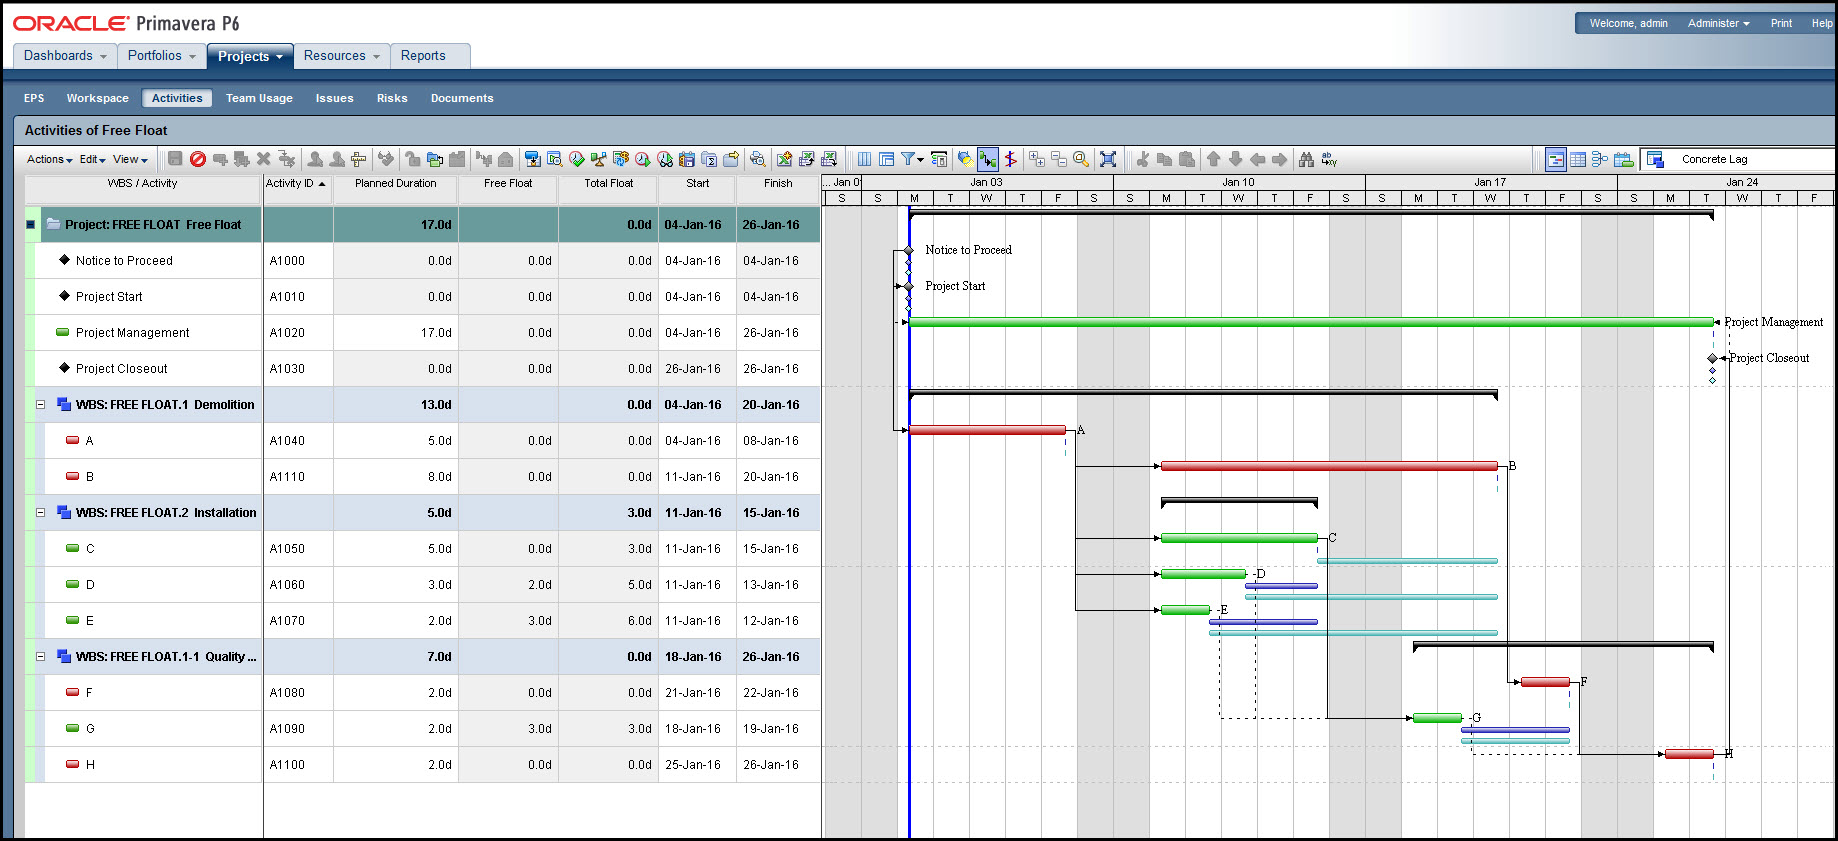
We have here in the activities view columns for both free float and total float.
The most important activities to note are all the activities with zero total float values. These are all the activities that cannot be late without affecting the entire project end date. They are your critical path activities. If you have activities with negative total float that tells you these activities and the schedule are already behind. Not good! Activities with a positive total float number can be postponed by the value listed in the total float column. You also want to note activities that have a small positive total float number. These are your near critical activities that could become critical with only minor delays.
Next of importance is to note all the activities that have a free float of zero. These are activities that cannot be shifted without impacting a successor activity. Why would this be important to know? Well, when you have a large crew to mobilize for a successor activity you want to note any predecessor activity that threatens to delay your successor activity. You definitely want to avoid large crews waiting around for the completion of a predecessor activity.
To get a better idea or quicker analysis of all activities that threaten other activities or the project end date we view both the total float and free float on the Gantt chart, Figure 1. Most important, all activities that cannot be extended without postponing the entire project appear on the Gantt chart as red bars. These activities all have zero total float. Positive number total float is displayed on our Gantt chart as light blue bars, Figure 1. The positive total float bars provide a quick view showing activity flexibility or how much each non-critical activity can be delayed without affecting the project end date.
Also of interest are the free float bars. Positive number free float is displayed on our Gantt chart as dark blue bars, Figure 1. This provides at a quick glance at how much each non-critical activity can be postponed without impacting a successor activity.
Note, in particular, activity C in Figure 1. The table view for activity C lists a free float of zero. Its free float bar on the Gantt chart is just a blip indicative of an activity having zero free float. Likewise, activity D free float column lists 2-days and the Gantt chart displays a 2-day free float bar for activity D.
Last, note activity G that has equivalent free float and total float bars. If G is shifted more than three days it will delay the successor H and the entire project.
That’s great! But how do you display the free float and total float on the Gantt chart? This is simple in P6 EPPM. Select the Gantt chart options icon in the top toolbar or View drop down menu. In the Bars tab, Figure 2, set the ‘Second Bar’ to Free Float Bar and the color of your choice, perhaps, dark blue.
Figure 2
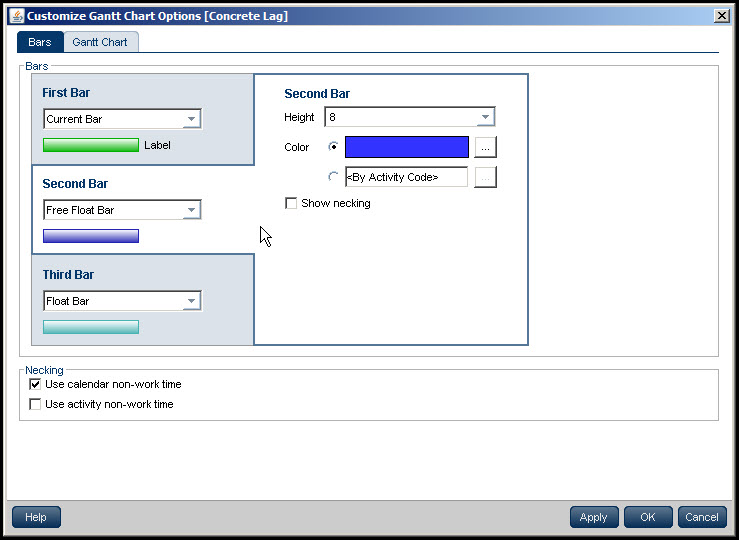
Also set the ‘Third Bar’ to Float Bar and the color to – let’s use – light blue. That’s it! You’re done! Your Gantt chart will now display all positive free float as dark blue bars and all positive total float as light blue bars.
Summary
Yes, a picture is worth many words. The Gantt chart graph is a valuable tool for analyzing the situation of a project. On the Gantt chart you can easily view the critical path, which displays in red all the activities that cannot be late without postponing the entire project.
Additionally, for activities with float you can display total float bars that readily show how many days each of these activities can be suspended before impacting the project end date.
Primavera P6 EPPM also allows you to display free float on the Gantt chart, which shows how many days each activity can extend without affecting a successor activity. It, of course, is important to note critical and near critical activities.
You may want to pay attention to the status of predecessor activities that have no free float. In particular, when you have significant daily mobilization costs on the successor activity. Commencement delays for these successor activities could be costly.