 Full Monte Sensitivity Analysis
The main purpose of sensitivity analysis is to show the contribution of each task to the overall uncertainty associated with either project completion or an interim deliverable (milestone). In Barbecana’s Full Monte the required target is selected on the Risk Analysis dialog. All sensitivity results are relative to this selection (and the only way to change the selection is re-run Risk Analysis with a different sensitivity target).
Consider this simple schedule:
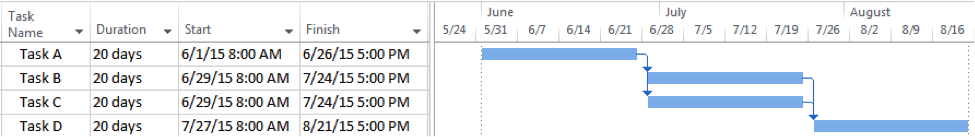
The schedule comprises four tasks, each with a duration of 20 days, with two parallel paths between the first and last task, and we will add duration uncertainty with a Normal distribution ±25% to all four tasks.
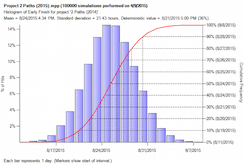
The resulting histogram for the project produced by Full Monte looks like this:
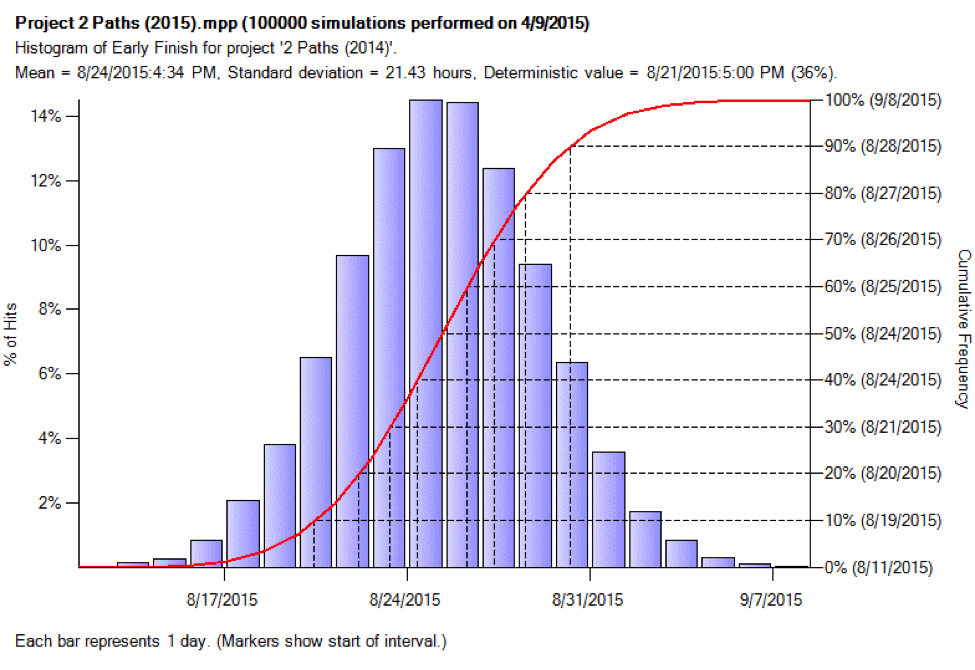
This shows us the mean (expected) finish of 8/24/15 and the range of possible values between 8/11/15 and 9/8/15. The 80% confidence (P80) date is 8/27/15.
The Tornado Sensitivity chart for the project completion looks like this:
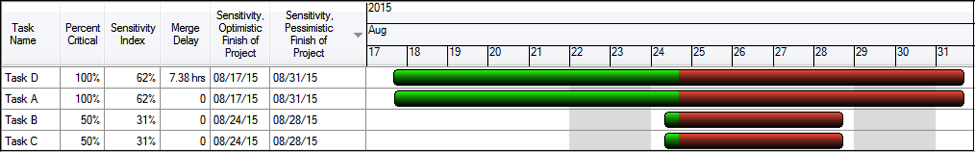
The bars are split (Green/Red) at the mean (expected) project finish date of 8/24/15.
Recall that all four tasks are identical (20d +-25%) however the chart is showing that tasks A and D are having a much greater effect on the variability of the project completion date compared to tasks B and C. It also shows that tasks B and C are having a larger detrimental impact (the red area) compared to their potential beneficial impact (the green area).
Tasks A and D are contributing more to the variability because they are always on the Critical Path (hence their higher sensitivity index).
The impact of task B and C on the variability of the project finish date is diminished (and skewed towards delaying it rather than improving it) because the tasks are in parallel. Because they are independent (i.e. uncorrelated) any benefit from task B finishing early will tend to be lost because task C may well finish later, and vice versa (This effect would be reduced if the tasks were correlated, and eliminated if the correlation were 100%).
Takeaways from this chart are:
- Tasks A and D are contributing the most uncertainty to the outcome.
- Reducing uncertainty on these tasks will probably reduce variability in the overall outcome
- Reducing the duration of these tasks will probably lead to a reduction in the overall program duration
- Switching these tasks (if possible) to another logic chain with float/slack will reduce uncertainty and bring the project in sooner
- Concentrate management effort to bring these tasks in on-time to ensure project success
- Skewed results like task B and task C indicate the critical path is changing during the simulations.
- Consider modifying the logic to firm up the critical path
- Use Merge Delay/Bias to identify merge points that are candidates for logic revision
Detailed Analysis
Full Monte allows a detailed analysis of the effect of specific tasks on the target by clicking on any row of the sensitivity Tornado chart.
Here is the detailed analysis for Task A

The two curves show the range of completion dates for the sensitivity target (in this case the project end date) based first on using the optimistic (left curve) and then the pessimistic duration (right curve) for task A.
Notes
The latest ‘Sensitivity Pessimistic Finish’ for the project shown on the Tornado chart is around 8/31/15. This is less than the worst case shown on the project finish histogram (9/8/15). This is because the Sensitivity Optimistic/Pessimistic Finishes are mean expected finishes for the project based on the most pessimistic durations for the task the dates are reported against. For example, for the purposes of calculating the Sensitivity Pessimistic Finish for the project based on the most pessimistic value for task A, all other tasks will still have a range of values from within their duration uncertainty. The date shown is the mean of all those possible finish dates.
However the detailed analysis does actually show a slightly later worst case finish date of 9/10/15 compared to 9/8/16 on the project finish histogram. This is because the dates shown on the project finish histogram are based on samples from all tasks having uncertainty while the detailed analysis forces the duration for the task being analyzed to its most pessimistic value (for the pessimistic curve) so this removes the chance of the task having a sampled duration closer to its optimistic value that may offset other tasks being closer to their pessimistic values thus tending to push the finish date out further. In reality the detailed analysis does not usually provide any added value over the Tornado chart.
Only tasks that have duration uncertainty and have some chance of being on the critical path are included in the sensitivity Tornado chart. There may be other important critical tasks in the logic that are not included in the Tornado chart because they have no duration uncertainty.