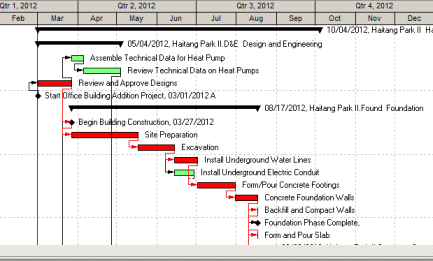
Since Henry Gantt conceived the idea around 1910, displaying a project schedule graphically with bars along a timescale has persisted into today’s most sophisticated and popular project scheduling systems. In this article we take a closer look at the Gantt chart in Primavera P6 Professional and explore some intriguing ways to customize its appearance.
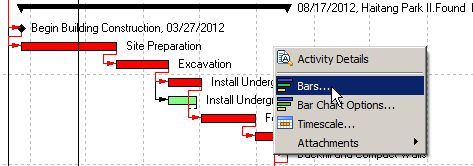
In Primavera P6 Professional the Bars dialog is used to control the appearance of the activities represented in the Gantt chart. Right-click on the Gantt chart and choose the Bars… option.
The Bars dialog itself is very intuitive when it comes to modifying the appearance of activities in the Gantt chart area. For that reason, this article will only skim over some of the basics. What is less well understood about this dialog is its relationship to the activity filters in the system. And it’s this aspect that we will be looking at in more depth.
Customizing Existing Bars
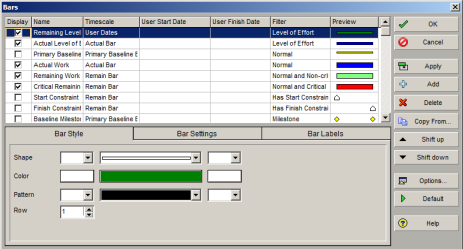
Changes to a bar’s appearance are made in the Bar Styles tab. The shape, color and pattern can be modified, along with the ability to add symbols and shapes at each end of the bar using the buttons in the Bar Styles tab.
The interesting part of this dialog is the flexible approach Primavera took to determining which bar gets displayed in the Gantt chart. To understand this, we need to look at the Filter column.
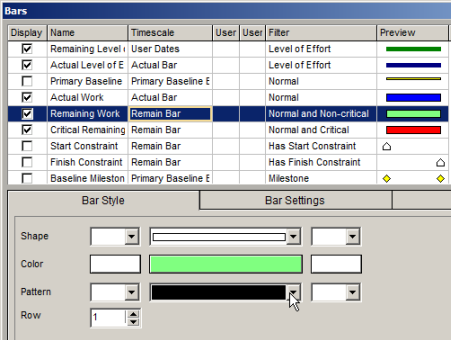
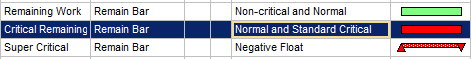
In the example above, the Remaining Work bar is selected. Its Filter is set to Normal and Non-critical. This literally means that any activity in the schedule that meets the filter criteria will be displayed with this bar’s appearance settings.
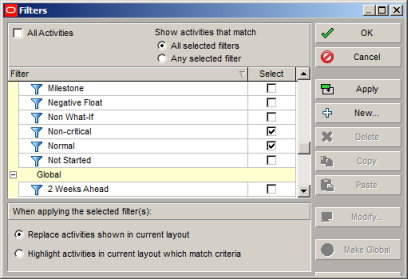
If we click on the Normal and Non-critical filter cell, the activity Filters dialog appears and we can see that the default filters named Non-critical and Normal are selected. Therefore any activity in the schedule that meets the normal and Non-critical filter criteria will be displayed as a green non-critical activity bar in the Gantt chart.
As the project progresses and non-critical activities become critical, P6 switches from displaying the Green bars to the Red bars for those activities: a neat way of building flexibility into the Gantt chart display controls.
Adding New Custom Bars
With this understanding, we can now let our imagination run amuck and create new bars that will be displayed if certain conditions are met. We could create bars that appear differently depending on an activity code – Departments, Project Phases and such might be good examples of this.
How about a new bar style that uses symbols on the ends to indicate it is super critical? Here’s how this would be done in the Bars dialog.
Using the Add button, a new bar has been created. In the Name column we’ve called it Super Critical. In the Timescale column, Remain Bar has been selected. The filter chosen for this is the default Negative Float filter.
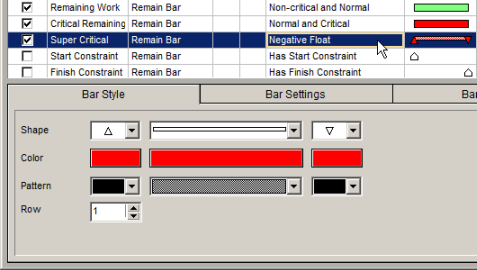
Finally the desired colors and symbols have been selected in the Bar Style tab. From here on, any bar that ends up in a negative float situation is going to change its appearance to that shown in the Preview column.
But wait…
What happened here? The bar doesn’t look quite right. It appears that there is a solid Red bar under our new super critical bar.
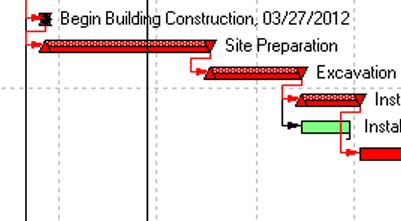
This is happening because the filter criterion for the original Red critical bar style is being met, along with the new super critical filter criteria, so P6 is displaying both bars – our super critical bar over the top of the normal and critical bars. A simple adjustment to the original Red critical bar filter selection will fix this.
The standard critical bar filter criteria are already able to display activities that are both critical and super critical using Total Float is less than or equal to zero days, so we can’t use this default critical filter.
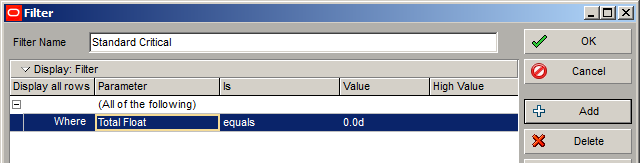
The fix is easy. We just need to create a filter that shows only Total Float = 0 days and switch that out in the Bars dialog. We’re calling this new filter ‘Standard Critical’.
In the Bars dialog, we change the Critical bar’s filter criteria to use our new Standard Critical filter criteria.
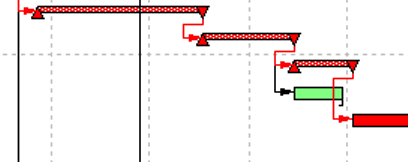
Finally our new super critical bar appears in the Gantt chart and gives a great visual clue that these activities have exceeded a constraint somewhere within the schedule and therefor have negative total float.
What would Mr. Gantt make of all this?
For more Primavera P6 tips click here