When preparing any program or project’s Integrated Master Schedule (IMS) one of the first steps is to identify the Key Program Milestones (KPMs). These collectively represent the key objectives and/or deliverables that are the elements of the Integrated Master Program (IMP) major milestones. These milestones are systematically segmented into chronological tasks or activities that are required to be accomplished and will comprise the IMS.
In the past, Program Planning personnel have developed and used many different techniques to communicate how well a schedule is being met and supporting their progress toward meeting each of the KPMs. The Baseline Execution Index (BEI) is a technique used to communicate to Program and Senior Management how well a team is performing the activities that comprise the IMS. This approach does not provide any insights into how well the executing team is meeting the KPMs.
Ten Six has been working with Steelray to develop a couple of tools that will enable each program/project team to independently assess how well they are performing on the activities that culminate in the successful accomplishment of each KPM. This approach capitalizes upon the network logic connecting each activity with their respective KPM. The two new tools are the Event Performance Indices (EPI) and the Overall Event Performance Indices (OEPI).
Event Performance Indices (EPI)
The EPI examines how well the executing program/project team has performed by dividing the sum of cum to date actual starts and completions by the sum of the cum to date baseline starts and completions planned through a specified point in time for the individual KPMs within the IMS. The scoring will result in a number ranging from 0 to =/> 1.0 to indicate how well the team has performed in actual starts & completions incurred to date, relative to the baseline planned starts & completions planned through a point in time for each KPM or milestone in the applicable IMS.
Overall Event Performance Indices (OEPI)
The OEPI does a similar analysis, but in this case the sum of cum to date actual starts and completions are divided by the sum of all baseline starts and completions from inception for each respective KPM in the IMS. The scoring will result in a number ranging from 0 incrementing to 1.0 for all KPMs major milestones successfully completed.
By using both the EPI and OEPI, the program/project team can communicate simple statistics that will tell how well they are accomplishing their progress for each KPM both cum to date and in the overall sense.
What follows are the details of how each of these tools calculates these statistics, which are being released in the upcoming version 5 of Steelray.
Description
The first metric Event Performance Indices (EPI) is similar to the Baseline Execution Index (BEI), but with two differences that improve it as an analysis tool. First, a review of BEI from DAU’s Acqipedia:
“BEI compares the cumulative number of tasks actually completed each month to the cumulative number of “baselined” tasks scheduled to be completed each month. If the contractor is completing more tasks than planned, the BEI will be higher, reflecting a higher throughput of tasks than planned. The BEI metric for a contract trips if it is less than .95.”
In all formulas (BEI, EPI, and Overall Event Performance Indices (OEPI)), actuals are in the numerator, and baselines in the denominator. The two differences:
Difference #1
- BEI: count number of tasks completed (either 0 or 1 per task)
- EPI: count number of actual starts and finishes (either, 0, 1 or 2 per task)
- Improvement: In EPI, you get a finer degree of granularity, because it counts tasks that started but didn’t finish in the reporting period.
Difference #2
- BEI: all tasks before the milestone date
- EPI and OEPI: only tasks that are in a link chain to the milestone
- Improvement: EPI gives you a more relevant performance indicator for a milestone.
The second metric (OEPI) is a cool way to calculate “percent complete” against a key milestone.
Calculation
For each specific milestone, we look only at the tasks (activities) that are driving the milestone, and calculate the formulas in this way:
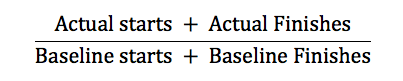
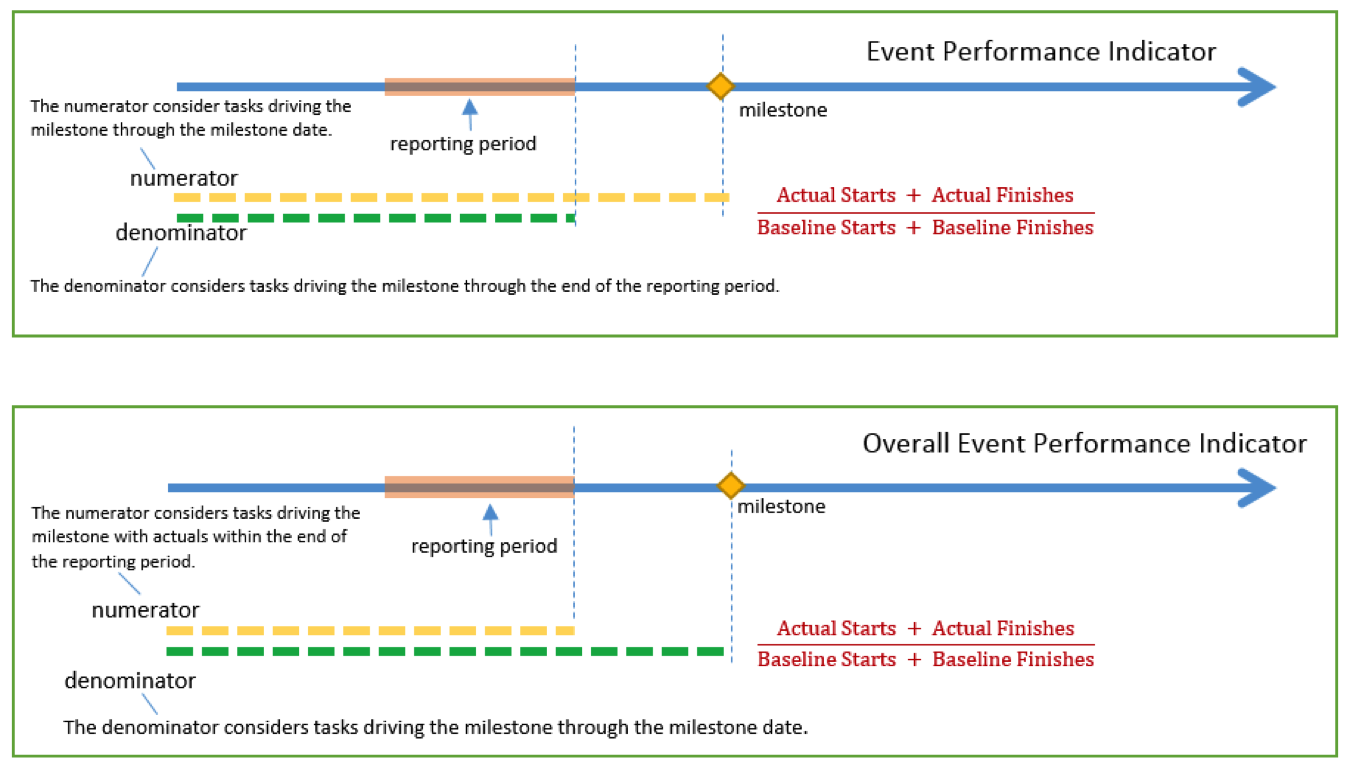
The difference between the two formulas lies in which tasks we consider in the numerator and denominator:
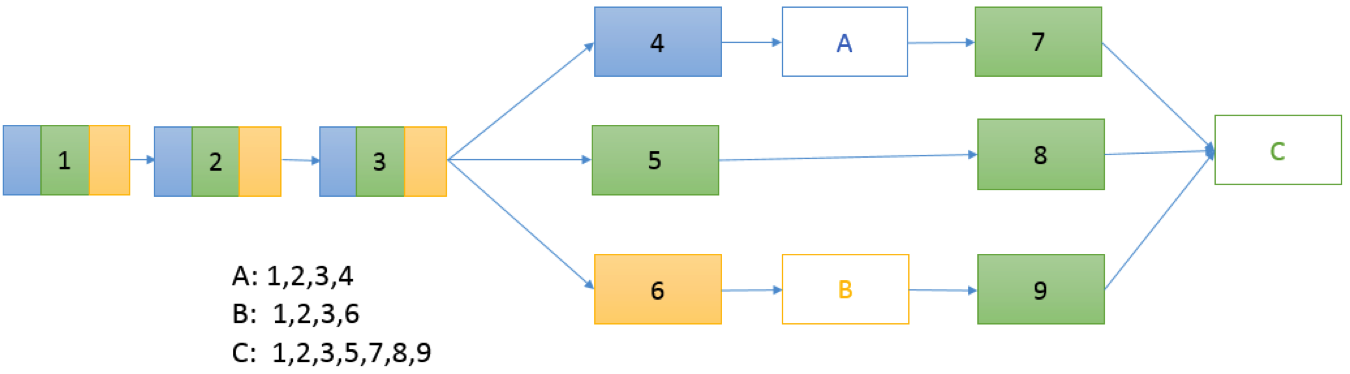
In this next example, tasks 1, 2, and 3 are driving tasks for all three milestones:
Output
The Analysis would produce a report which looked something like this:
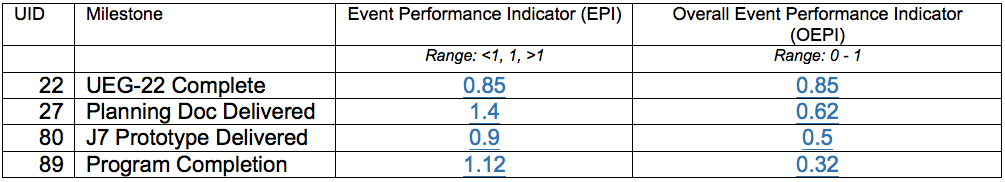
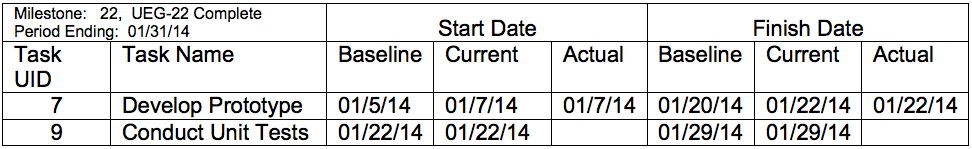
When you click on a result (e.g. 0.85), you’ll see a detail report on the milestone that shows which tasks were considered in the calculation of the result that you clicked on.
Event Performance Indicator: 0.85
Summary
At Ten Six, we believe that these indices, which are also supported by Steelray, will provide Program Managers with additional tools to help measure program performance. The extra focus on Key Program Milestones using the Event Performance Indices (EPI) and the Overall Event Performance Indices (OEPI) described above are very useful metrics. The upcoming release by Steelray will, no doubt, attract a lot of interest with the addition if these new capabilities.