Level of Effort (LOE) activities in Primavera P6 are typically used to define effort that in and of itself doesn’t generate a deliverable, but does incur labor/costs to the project. Items such as management, security or safety are ongoing and require resources but are not on the critical path. These overhead costs are usually not immaterial. Overhead efforts can span part of the project, or the entire life-cycle. They are also associated with other activities in the project.
Modeling these efforts and cost individually by assigning resources to every activity is prohibitive. So how does one easily define the effort of these tasks throughout the life-cycle of the project? Well, Primavera P6 has a Level of Effort activity type to help you model this type of work in a low-maintenance way, and one that does not interfere with the critical path.
This article describes how to model administrative overhead and project management costs that are associated with the project, and that can span part or all of the duration of the project.
Cost Accounting
Companies have different ways of accounting for administrative costs. Cost estimating guides, such as RS Means, place overhead and profit costs directly into the standard pay rate for each of the resources. Primavera P6 allows you to make a line item for both the administrative and project management costs of the project using LOE activities.
Primavera P6 also allows you to distribute these costs either evenly among the project tasks or in some kind of defined curve. Project management costs are usually uniform throughout the project, whereas, administrative costs may follow a bell shaped curve. Both distribution shapes may be modeled in Primavera P6.
Project Management and Administrative Efforts
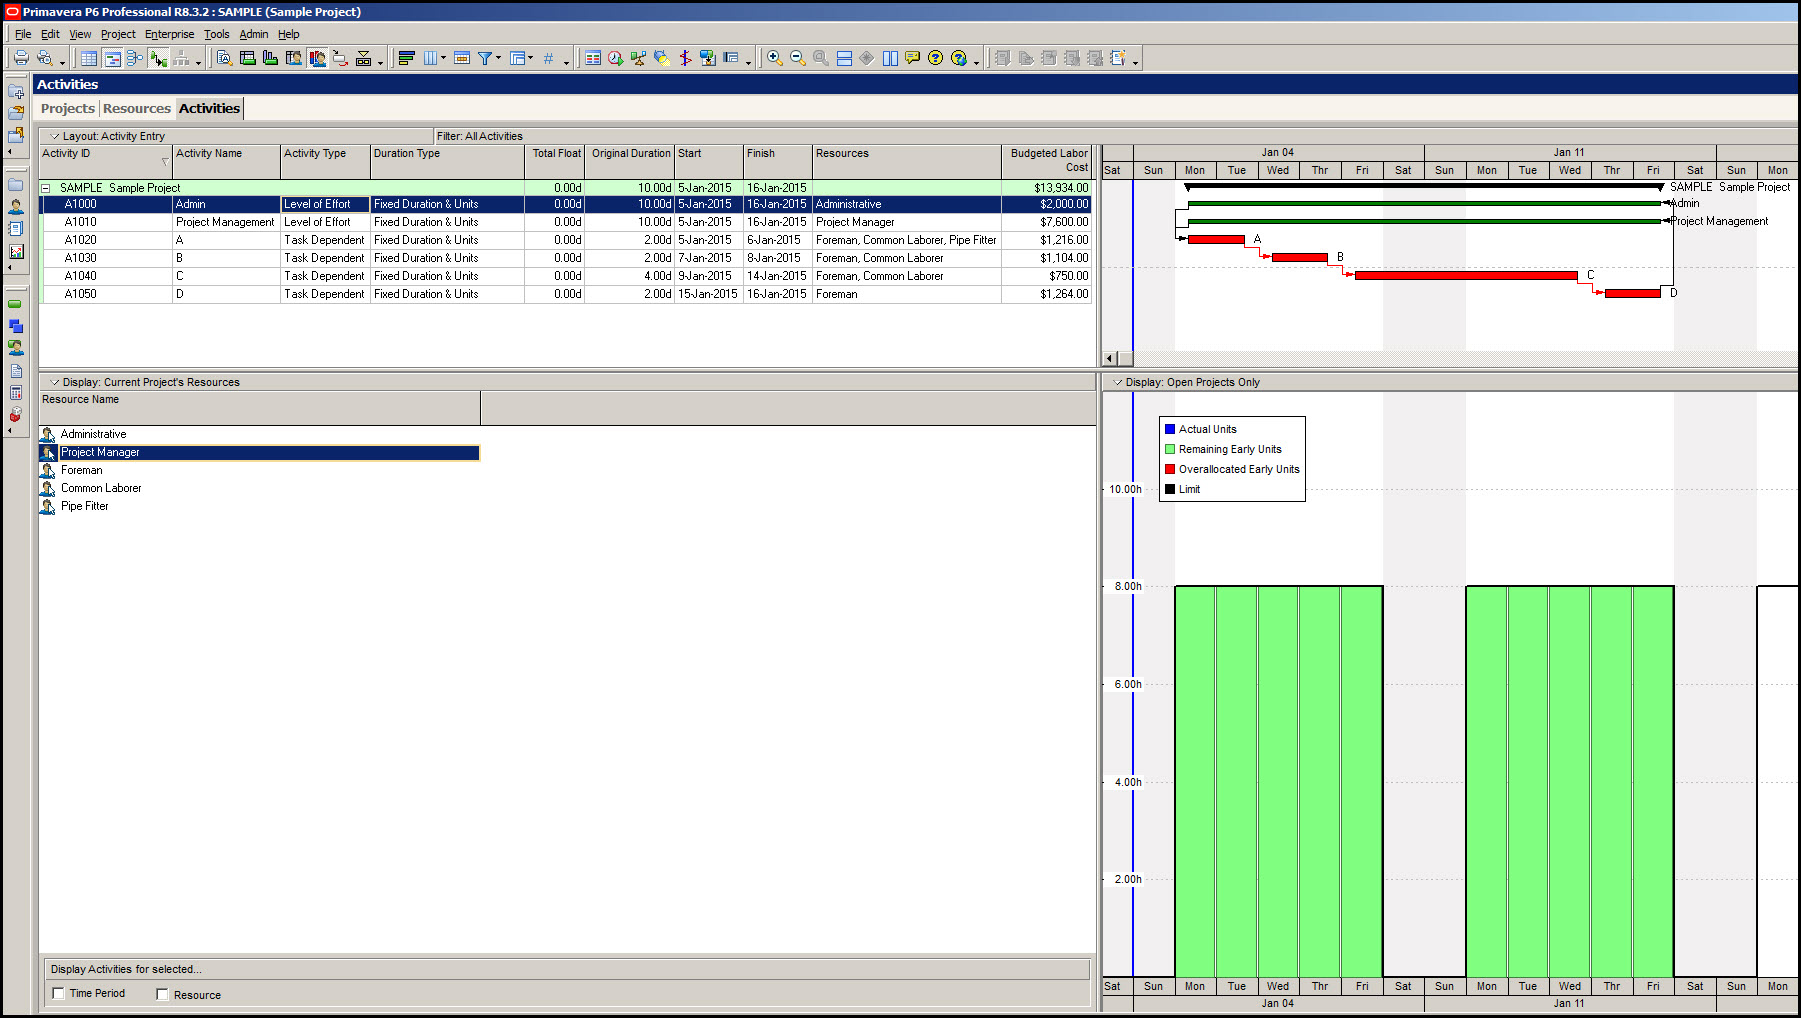
Figure 1 displays a project with four Task Dependent activities A, B, C, and D with standard Finish-to-Start relationships. Each of these activities are shown in the Gantt chart view as red bars, which indicates that these activities are on the critical path. Also, displayed in Figure 1 are two additional Gantt chart bars: one specifying the project management effort and the other administrative overhead. Note that although both project management and administrative efforts span the entire length of the project neither is on the critical path, which, again, is shown in red.
 Figure 1
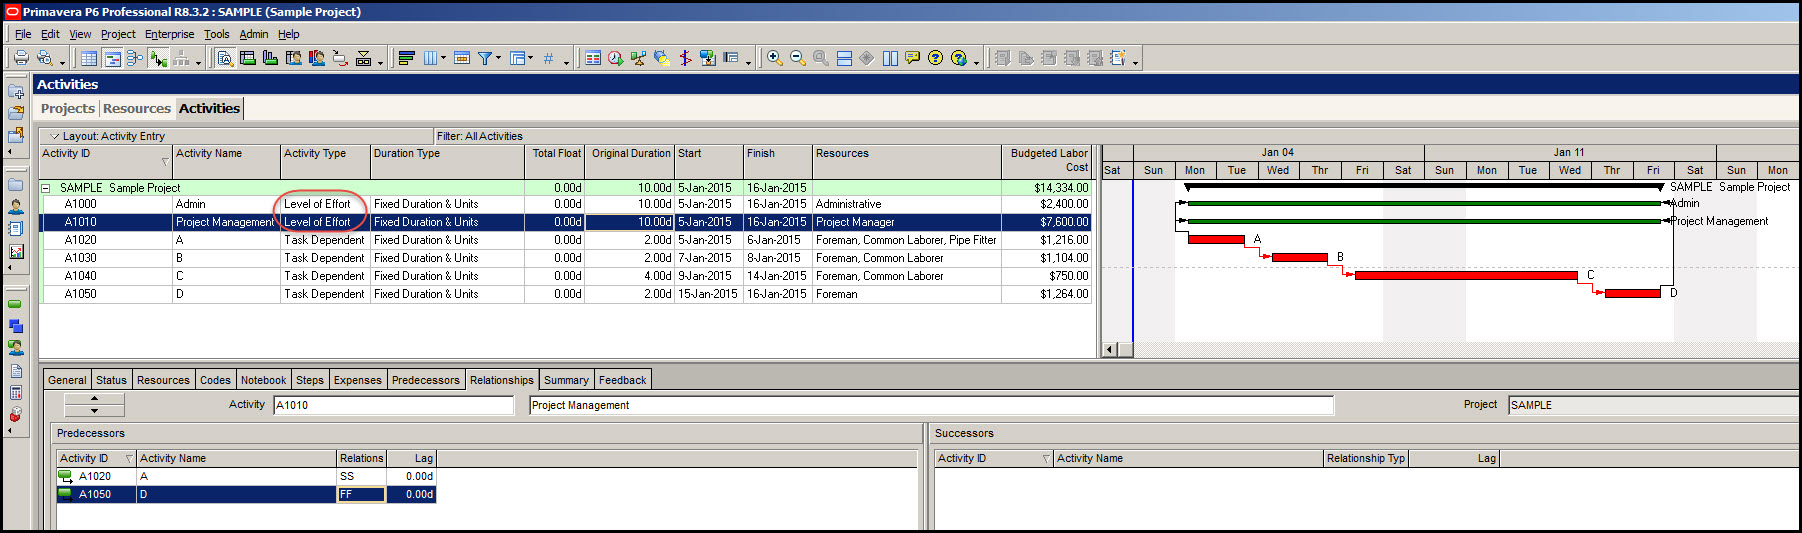
Both project management and administrative efforts are predecessors to the first task A in a Start-to-Start relationship and both are successors to the last task D in a Finish-to-Finish relationship, Figure 1. What distinguishes the project management and administrative efforts from other activities is that they have an Activity Type designation of ‘Level of Effort’. This indicates that they do not directly produce deliverables and, therefore, are indirect costs. They are, however, efforts that none-the-less generate costs that need to be accounted for.
Because these administrative and project management level of effort activities are connected to both the first task A and last task D they will both grow and shrink in direct correlation to the expansion and/or contraction of the project schedules critical path. This connection of each level of effort activity to the first task and last task has led to the designation of these activities being called ‘hammocks’. As an exercise, try increasing the duration of any activity on the critical path. Notice that the duration of the Level of Effort activities automatically increases in correlation to the critical path duration when the project is scheduled.
Effort Distribution Curve
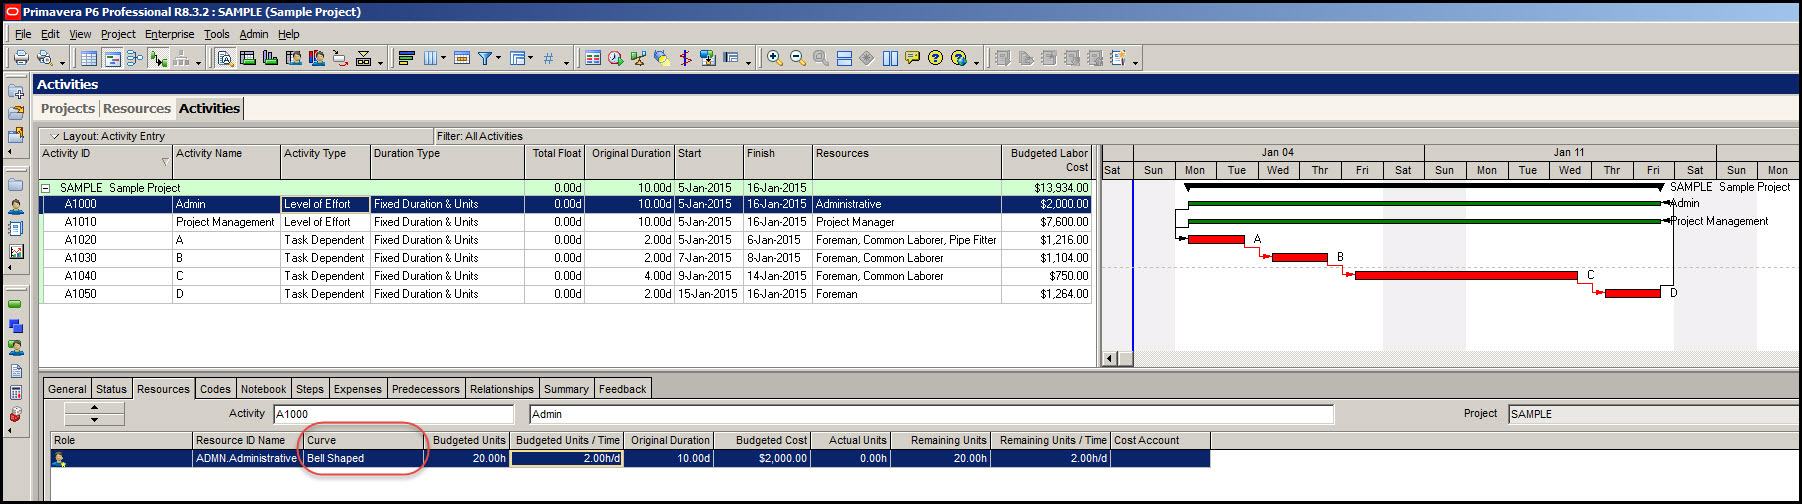
What delineates the project management effort from the administrative effort, besides the hourly pay rate, is that the project management cost is uniform throughout the project, whereas, administrative costs in this example will most likely follow a bell shaped curve. How does one describe the non-uniform distribution of administrative costs? Primavera P6 allows you to associate a curve with the effort. Notice in Figure 2 that the Resources tab in the bottom detail has a curve column to define the curve of the effort.
Figure 2
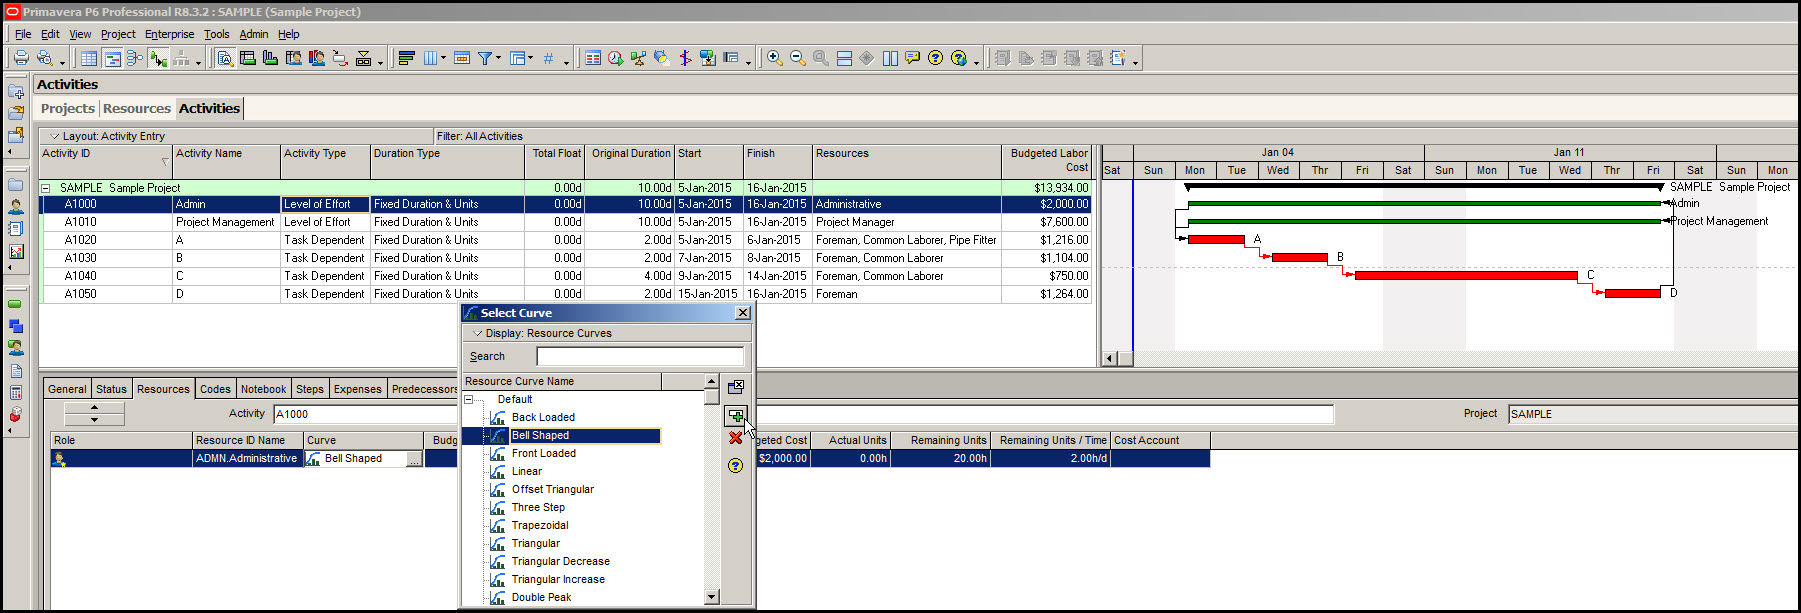
Left-click the Curve cell to bring up the list of available curves, Figure 3.
Primavera P6 allows you to define your own curve, but for the purpose of this project select the Bell Shaped curve.
Figure 3
To view your administrative cost bell curve distribution, select the Resource Usage Profile icon in the bottom layout tool group, Figure 4.
Figure 4
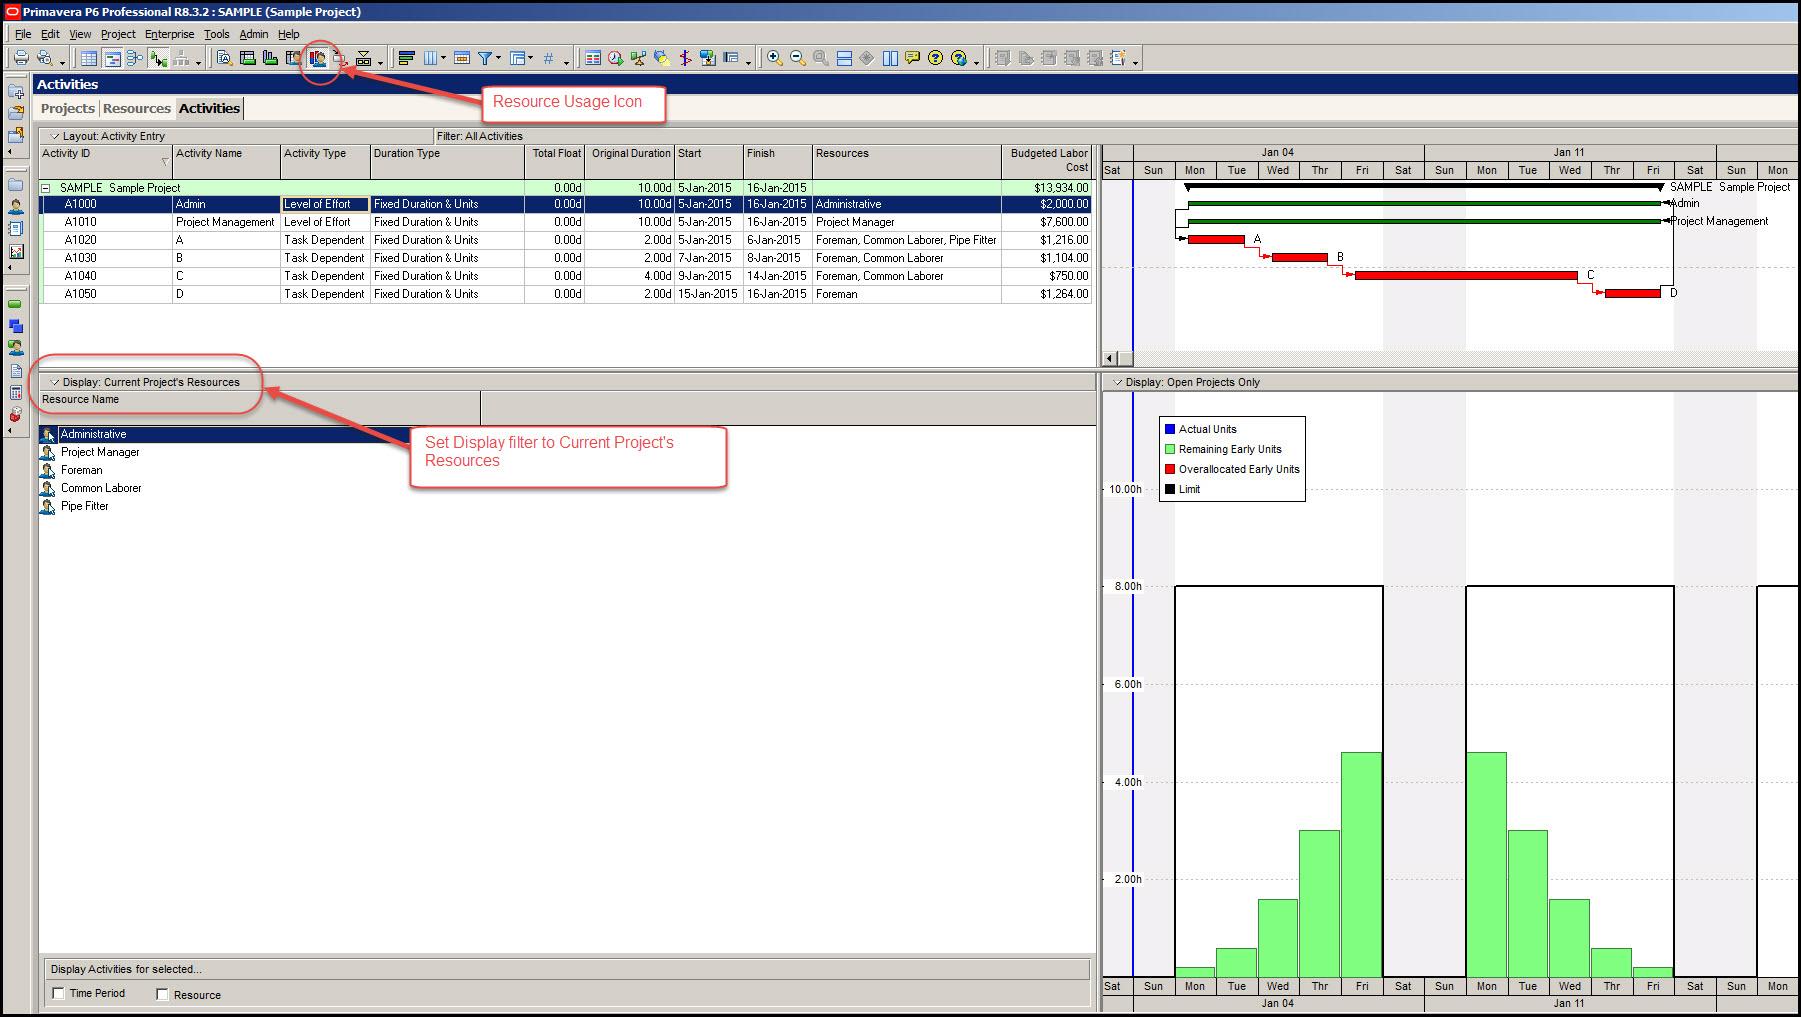
Make sure the display is set to Current Project’s Resources. Select Administrative from the list of Resource Names. Also, set the time scale of the Gantt chart to Week/Day2. Now select Project Management from the list of Resource Names. Note that the project management curve is a uniform 8-hours/day, Figure 5.
Figure 5
Summary
Describing activities that do not directly produce deliverables and that expand and contract with the critical path is difficult to do in some scheduling software programs. Primavera P6, however, has a ‘Level of Effort’ activity designation that is able to model indirect costs that span the life of the project. It is also able to show the expansion and contraction of the effort in step with the growing or shrinking duration of the critical path.
One thing to note: if you use Level of Effort (LOE) activities in Primavera P6 and assign a resource to it, make sure to assign a resource curve to the LOE. If you don’t do this, all of your resources distribution will stack up at the beginning and will not be spread over the length of the LOE duration.
The level of effort Type activity is a seemingly small feature that is nevertheless important. This is one reason why Primavera P6 is often selected as the scheduling system of choice, particularly when integrating with earned value management systems.